








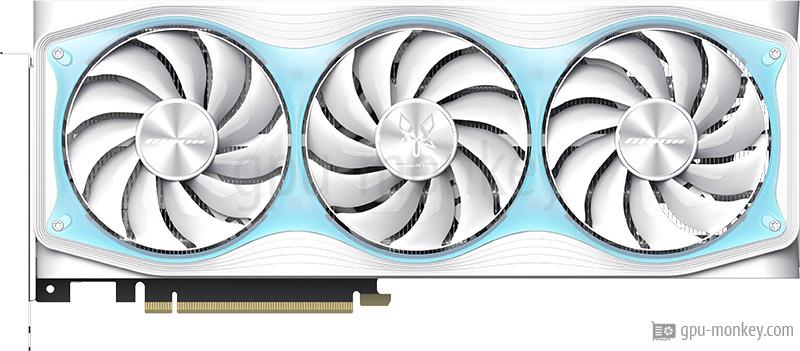
Manli Polar Fox GeForce RTX 5070 OC

Manli Polar Fox GeForce RTX 5070 OC in 3DMark Benchmark (DirectX, Raytracing)

Hier kannst Du sehen, wie schnell die Manli Polar Fox GeForce RTX 5070 OC in 3DMark Benchmark (DirectX, Raytracing) ist. Die Leistung der Grafikkarte in Benchmarks oder Spielen hängt dabei in erster Linie von der GPU-Architektur, der Anzahl der Textur-Shader und der Speichergröße ab. Die Manli Polar Fox GeForce RTX 5070 OC besitzt 12 GB GDDR7 Speicher.

Turbo-Frequenz
2,54GHz
Speicher
12GB GDDR7
Shader
6144
Speicherbandbreite
672GB/s

3DMark Benchmark (DirectX, Raytracing)

3DMark ist ein Benchmarkprogramm, das die Leistung bestimmter Komponenten eines Computers ermittelt und die Leistung dann anhand eines Zahlenwertes ausgibt.
Time Spy Graphics score Platz 783 / 5.638

  1. 22.468
  2. 22.468
  3. 22.468
  4. 22.468
  5. 22.468
  6. 22.468
  7. 22.468

Time Spy Extreme Graphics score Platz 836 / 5.633

  1. 10.763
  2. 10.763
  3. 10.763
  4. 10.763
  5. 10.763
  6. 10.763
  7. 10.763

Steel Nomad Light Graphics score Platz 667 / 1.247

  1. 22.751
  2. 22.751
  3. 22.751
  4. 22.751
  5. 22.751
  6. 22.751
  7. 22.751

Steel Nomad Graphics score Platz 725 / 1.247

  1. 4.860
  2. 4.860
  3. 4.860
  4. 4.860
  5. 4.860
  6. 4.860
  7. 4.860

Port Royal (Raytracing) Platz 735 / 4.176

  1. 14.225
  2. 14.225
  3. 14.225
  4. 14.225
  5. 14.225
  6. 14.225
  7. 14.225

Speed Way Graphics Score (Raytracing) Platz 676 / 3.536

  1. 5.916
  2. 5.916
  3. 5.916
  4. 5.916
  5. 5.916
  6. 5.916
  7. 5.916

Solar Bay (Raytracing) Platz 725 / 1.247

  1. 102.814
  2. 102.814
  3. 102.814
  4. 102.814
  5. 102.814
  6. 102.814
  7. 102.814

Weitere Benchmarks für die Grafikkarte Manli Polar Fox GeForce RTX 5070 OC