


3DMark Benchmark (DirectX, Raytracing)
3DMark ist ein Benchmarkprogramm, das die Leistung bestimmter Komponenten eines Computers ermittelt und die Leistung dann anhand eines Zahlenwertes ausgibt.
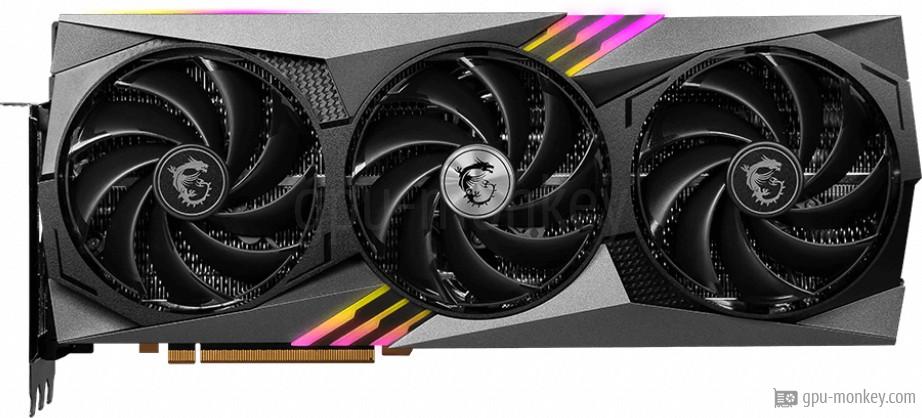
Hier kannst Du sehen, wie schnell die MSI GeForce RTX 4090 GAMING TRIO 24G in 3DMark Benchmark (DirectX, Raytracing) ist. Die Leistung der Grafikkarte in Benchmarks oder Spielen hängt dabei in erster Linie von der GPU-Architektur, der Anzahl der Textur-Shader und der Speichergröße ab. Die MSI GeForce RTX 4090 GAMING TRIO 24G besitzt 24 GB GDDR6X Speicher.
3DMark ist ein Benchmarkprogramm, das die Leistung bestimmter Komponenten eines Computers ermittelt und die Leistung dann anhand eines Zahlenwertes ausgibt.


 Cyberpunk 2077MSI GeForce RTX 4090 GAMING TRIO 24G
 The Last of Us Part 1MSI GeForce RTX 4090 GAMING TRIO 24G
 GTA 5 BenchmarkMSI GeForce RTX 4090 GAMING TRIO 24G
 Shadow of the Tomb RaiderMSI GeForce RTX 4090 GAMING TRIO 24G
 Battlefield 5MSI GeForce RTX 4090 GAMING TRIO 24G
 Geekbench 6MSI GeForce RTX 4090 GAMING TRIO 24G
 Crypto-Mining Ethereum HashrateMSI GeForce RTX 4090 GAMING TRIO 24G
 Crypto-Mining Ergo HashrateMSI GeForce RTX 4090 GAMING TRIO 24G
 Crypto-Mining Ravencoin HashrateMSI GeForce RTX 4090 GAMING TRIO 24G
 Crypto-Mining Vertcoin HashrateMSI GeForce RTX 4090 GAMING TRIO 24G
 FP32 RechenleistungMSI GeForce RTX 4090 GAMING TRIO 24G

