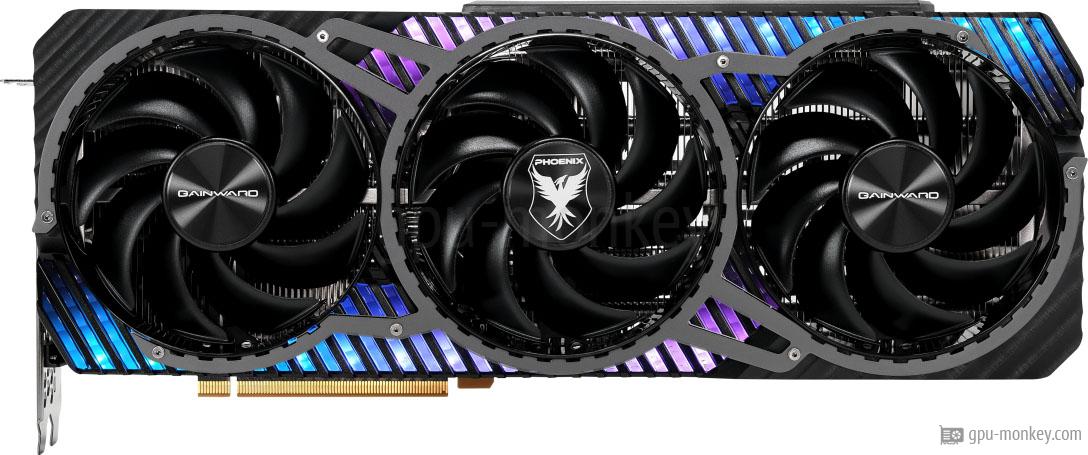
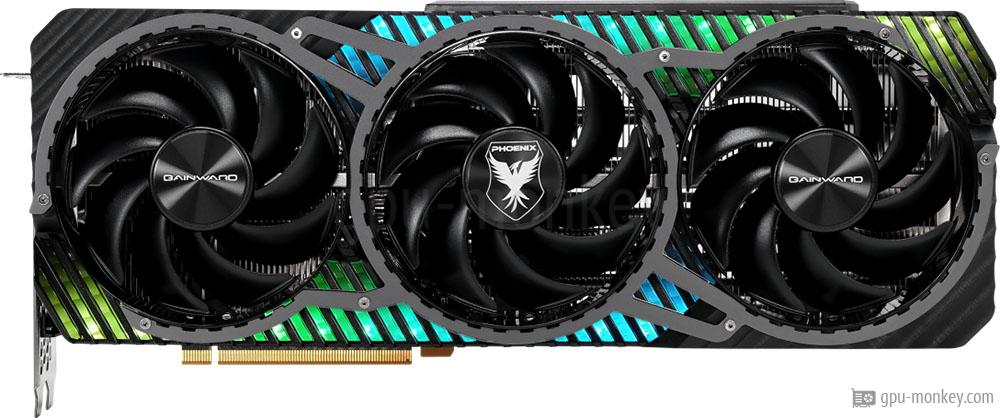
Gainward GeForce RTX 4080 SUPER Phoenix GS
NVIDIA NVIDIA GeForce RTX 4080 SUPER Speed-Index 44/100 Letzte Aktualisierung:

Gainward GeForce RTX 4080 SUPER Phoenix GS Benchmark und Technische Daten

Wir zeigen dir hier Benchmarks und technische Daten für die Gainward GeForce RTX 4080 SUPER Phoenix GS. Die Grafikkarte basiert auf der NVIDIA GeForce RTX 4080 SUPER (Ada Lovelace) und besitzt 16 GB GDDR6X Grafikspeicher mit einer Speicherbandbreite von 736 GB/s. Die Gainward GeForce RTX 4080 SUPER Phoenix GS besitzt 80 Ausführungseinheiten mit 10240 Shadern.
FP32
53,45TFLOPS
Turbo-Frequenz
2,61GHz
Speicher
16GB GDDR6X
TDP
320 W

Technische Daten

GPU

Die Gainward GeForce RTX 4080 SUPER Phoenix GS besitzt 10240 Shader und 80 Ausführungseinheiten. Damit erreicht die Grafikkarte eine theoretische FP32-Rechenleistung von 53,45 TFLOPS.

GPU Chip
AD103-400-A1 (Ada Lovelace)
Streaming Multiprozessoren
80
Shader
10240
Render Output Units
112
Texture Units
320
Raytracing Cores
80

Speicher

Die Gainward GeForce RTX 4080 SUPER Phoenix GS kann auf 16 GB Grafikspeicher des Typs GDDR6X zurückgreifen. Damit erreicht die Grafikkarte eine Speicherbandbreite von 736 GB/s an einem 256 bit breiten Speicherinterface.

Speichergröße
16 GB
Speichertyp
GDDR6X
Speichertakt
1,438 GHz
Geschwindigkeit
23,0 Gbps
Speicherbandbreite
736 GB/s
Speicherinterface
256 bit

Taktfrequenzen

Die Basis-Taktfrequenz der Gainward GeForce RTX 4080 SUPER Phoenix GS liegt bei 2,295 GHz. Eine hohe Taktfrequenz (auch im Turbo-Modus) kann die Geschwindigkeit einer Grafikkarte stark erhöhen.

Basisfrequenz
2,295 GHz
Turbo-Frequenz
2,610 GHz+2 %
Übertaktbar
Ja

Thermisches Design

Die TDP (Thermal Design Power) der Gainward GeForce RTX 4080 SUPER Phoenix GS liegt bei 320 W. Die Grafikkarte wird über 1 x 16-Pin Stecker mit Energie versorgt.

TDP
320 W (Referenz)
Tjunction max
90 °C
PCIe-Power
1 x 16-Pin

Kühler & Lüfter

Die Gainward GeForce RTX 4080 SUPER Phoenix GS verfügt über insgesamt 3 Axial Lüfter zur Kühlung des Grafikprozessors und des Grafikspeichers.

Lüftertyp
Axial
Lüfter 1
3 x 100 mm
Kühlertyp
Luftkühlung
Lautstärke (Leerlauf)
0 dB / Lautlos

Konnektivität

Bis zu 4 Bildschirme lassen sich an die Gainward GeForce RTX 4080 SUPER Phoenix GS anschließen.

Max. Bildschirme
4
HDCP
2.3
HDMI
1x HDMI 2.1a
DisplayPort
3x DP 1.4a

Featureset

Die Gainward GeForce RTX 4080 SUPER Phoenix GS besitzt eine maximale Auflösung von 7680x4320 Pixeln. Die Grafikkarte unterstützt den DirectX 12_2 (Ultimate) Standard.

Max. Auflösung
7680x4320
DirectX
12_2 (Ultimate)
Raytracing
Ja
DLSS / FSR
Ja
LED
Anpassbare LED

Unterstützte Video-Codecs

Die von der Gainward GeForce RTX 4080 SUPER Phoenix GS in Hardware beschleunigten Video-Codecs reduzieren die Prozessorlast und sorgen für eine geringere Energieaufnahme.

h264
Dekodieren / Enkodieren
h265 / HEVC
Dekodieren / Enkodieren
VP8
Dekodieren
VP9
Dekodieren
AV1
Dekodieren

Abmaße

Die Gainward GeForce RTX 4080 SUPER Phoenix GS ist 329 mm lang und 131 mm hoch. Mit einer Breite von 64 mm benötigt die Grafikkarte 4 PCIe-Slots im Gehäuse.

Länge
329 mm
Höhe
131 mm
Breite
64 mm
Breite (Slots)
4 PCIe-Slots
SFF-Ready
Nein

Zusätzliche Daten

Erschienen ist die in 5 nm gefertigte Gainward GeForce RTX 4080 SUPER Phoenix GS im Q1/2024 für 999 $.

GPU-Schnittstelle
PCIe 4.0 x 16
Erscheinungsdatum
Q1/2024
Einführungspreis
999 $ (Referenz)
Strukturgröße
5 nm
Artikelnummer
NED408ST19T2-1032X
Dokumente
Datenblatt
Gainward GeForce RTX 4080 SUPER Phoenix GS
2,295 GHz · 16 GB · 320 W TDP
Diese Grafikkarte bei Amazon kaufen!

Mit anderen GPUs vergleichen

Modellnamen eingeben – der Vergleich öffnet sich automatisch.

Diese Grafikkarte bewerten

Hier kannst Du diese Grafikkarte bewerten, und damit anderen Besuchern bei ihrer Kaufentscheidung helfen. Die durchschnittliche Bewertung diese Grafikkarte liegt aktuell bei 0 Sternen (0 Bewertungen). Jetzt selbst bewerten:

Benchmark Ergebnisse

3DMark Benchmark (DirectX, Raytracing)

3DMark ist ein Benchmarkprogramm, das die Leistung bestimmter Komponenten eines Computers ermittelt und die Leistung dann anhand eines Zahlenwertes ausgibt.

Time Spy Extreme Graphics score Platz 285 / 5.633

  1. Gainward GeForce RTX 4080 SUPER Phoenix GSGainward GeForce RTX 4080 SUPER Phoenix GS16 GB GDDR6X

    14.229
  2. NVIDIA GeForce RTX 4080 SUPERNVIDIA GeForce RTX 4080 SUPERDurchschnitt der GPU-Gruppe
    14.063

Steel Nomad Light Graphics score Platz 265 / 1.247

  1. Gainward GeForce RTX 4080 SUPER Phoenix GSGainward GeForce RTX 4080 SUPER Phoenix GS16 GB GDDR6X

    31.253
  2. NVIDIA GeForce RTX 4080 SUPERNVIDIA GeForce RTX 4080 SUPERDurchschnitt der GPU-Gruppe
    30.889

Steel Nomad Graphics score Platz 265 / 1.247

  1. Gainward GeForce RTX 4080 SUPER Phoenix GSGainward GeForce RTX 4080 SUPER Phoenix GS16 GB GDDR6X

    7.336
  2. NVIDIA GeForce RTX 4080 SUPERNVIDIA GeForce RTX 4080 SUPERDurchschnitt der GPU-Gruppe
    7.251

Port Royal (Raytracing) Platz 364 / 4.176

  1. Gainward GeForce RTX 4080 SUPER Phoenix GSGainward GeForce RTX 4080 SUPER Phoenix GS16 GB GDDR6X

    18.517
  2. NVIDIA GeForce RTX 4080 SUPERNVIDIA GeForce RTX 4080 SUPERDurchschnitt der GPU-Gruppe
    18.301

Speed Way Graphics Score (Raytracing) Platz 357 / 3.536

  1. Gainward GeForce RTX 4080 SUPER Phoenix GSGainward GeForce RTX 4080 SUPER Phoenix GS16 GB GDDR6X

    7.527
  2. NVIDIA GeForce RTX 4080 SUPERNVIDIA GeForce RTX 4080 SUPERDurchschnitt der GPU-Gruppe
    7.439

Solar Bay (Raytracing) Platz 284 / 1.247

  1. Gainward GeForce RTX 4080 SUPER Phoenix GSGainward GeForce RTX 4080 SUPER Phoenix GS16 GB GDDR6X

    140.028
  2. NVIDIA GeForce RTX 4080 SUPERNVIDIA GeForce RTX 4080 SUPERDurchschnitt der GPU-Gruppe
    138.398

Cyberpunk 2077

Cyberpunk 2077 wurde von CD Projekt Red entwickelt und basiert auf der hauseigenen REDengine 4 des Entwicklerstudios. In unseren Benchmarks ist Raytracing abgeschaltet.

3840x2160 (2160p) Platz 93 / 3.187

  1. Gainward GeForce RTX 4080 SUPER Phoenix GSGainward GeForce RTX 4080 SUPER Phoenix GS16 GB GDDR6X

    77 fps (avg)
  2. NVIDIA GeForce RTX 4080 SUPERNVIDIA GeForce RTX 4080 SUPERDurchschnitt der GPU-Gruppe
    75 fps (avg)

2560x1440 (1440p) Platz 101 / 3.190

  1. Gainward GeForce RTX 4080 SUPER Phoenix GSGainward GeForce RTX 4080 SUPER Phoenix GS16 GB GDDR6X

    133 fps (avg)
  2. NVIDIA GeForce RTX 4080 SUPERNVIDIA GeForce RTX 4080 SUPERDurchschnitt der GPU-Gruppe
    130 fps (avg)

1920x1080 (1080p) Platz 108 / 3.222

  1. Gainward GeForce RTX 4080 SUPER Phoenix GSGainward GeForce RTX 4080 SUPER Phoenix GS16 GB GDDR6X

    189 fps (avg)
  2. NVIDIA GeForce RTX 4080 SUPERNVIDIA GeForce RTX 4080 SUPERDurchschnitt der GPU-Gruppe
    185 fps (avg)

The Last of Us Part 1

The Last of Us Part One ist ein im Juni 2013 von Sony exklusiv für die Playstation veröffentlichtes Spiel, das Anfang 2023 für den PC veröffentlicht wurde. Die hier Benchmark-Werte wurden bei hohen Details ermittelt.

3840x2160 (2160p) Platz 101 / 2.190

  1. Gainward GeForce RTX 4080 SUPER Phoenix GSGainward GeForce RTX 4080 SUPER Phoenix GS16 GB GDDR6X

    60 fps (avg)
  2. NVIDIA GeForce RTX 4080 SUPERNVIDIA GeForce RTX 4080 SUPERDurchschnitt der GPU-Gruppe
    59 fps (avg)

2560x1440 (1440p) Platz 90 / 2.709

  1. Gainward GeForce RTX 4080 SUPER Phoenix GSGainward GeForce RTX 4080 SUPER Phoenix GS16 GB GDDR6X
    116 fps (avg)
  2. NVIDIA GeForce RTX 4080 SUPERNVIDIA GeForce RTX 4080 SUPERDurchschnitt der GPU-Gruppe
    113 fps (avg)

1920x1080 (1080p) Platz 103 / 2.843

  1. Gainward GeForce RTX 4080 SUPER Phoenix GSGainward GeForce RTX 4080 SUPER Phoenix GS16 GB GDDR6X
    158 fps (avg)
  2. NVIDIA GeForce RTX 4080 SUPERNVIDIA GeForce RTX 4080 SUPERDurchschnitt der GPU-Gruppe
    154 fps (avg)

Battlefield 5

Battlefield 5 ist ein optisch beeindruckendes Spiel, welches sich ideal als Grafikkarten-Benchmark eignet. Wir testen das Spiel mit maximalen Details unter Windows 10.

3840x2160 (2160p) Platz 101 / 4.595

  1. Gainward GeForce RTX 4080 SUPER Phoenix GSGainward GeForce RTX 4080 SUPER Phoenix GS16 GB GDDR6X
    162 fps (avg)
  2. NVIDIA GeForce RTX 4080 SUPERNVIDIA GeForce RTX 4080 SUPERDurchschnitt der GPU-Gruppe
    158 fps (avg)

2560x1440 (1440p) Platz 178 / 4.594

  1. Gainward GeForce RTX 4080 SUPER Phoenix GSGainward GeForce RTX 4080 SUPER Phoenix GS16 GB GDDR6X
    205 fps (avg)
  2. NVIDIA GeForce RTX 4080 SUPERNVIDIA GeForce RTX 4080 SUPERDurchschnitt der GPU-Gruppe
    200 fps (avg)

1920x1080 (1080p) Platz 472 / 4.601

  1. Gainward GeForce RTX 4080 SUPER Phoenix GSGainward GeForce RTX 4080 SUPER Phoenix GS16 GB GDDR6X
    205 fps (avg)
  2. NVIDIA GeForce RTX 4080 SUPERNVIDIA GeForce RTX 4080 SUPERDurchschnitt der GPU-Gruppe
    200 fps (avg)

Geekbench 6 (OpenCL, Vulkan, Metal)

Geekbench 6 ist ein Cross-Platform-Benchmark für Hauptprozessoren, der zusätzlich auch 3 verschiedene Grafik-Benchmarks durchführt und in Form eines Zahlenwertes ausgibt.

Geekbench 6 - OpenCL Platz 103 / 5.255

  1. Gainward GeForce RTX 4080 SUPER Phoenix GSGainward GeForce RTX 4080 SUPER Phoenix GS16 GB GDDR6X
    260.693
  2. NVIDIA GeForce RTX 4080 SUPERNVIDIA GeForce RTX 4080 SUPERDurchschnitt der GPU-Gruppe
    254.694

Geekbench 6 - Vulkan Platz 109 / 5.233

  1. Gainward GeForce RTX 4080 SUPER Phoenix GSGainward GeForce RTX 4080 SUPER Phoenix GS16 GB GDDR6X
    224.410
  2. NVIDIA GeForce RTX 4080 SUPERNVIDIA GeForce RTX 4080 SUPERDurchschnitt der GPU-Gruppe
    219.246

MonkeyBench 2026.3 · Browser-GPU-Test

Durchschnitt aus 25 öffentlichen MonkeyBench-Ergebnissen (WebGPU) für die NVIDIA GeForce RTX 4080 SUPER.

978GPU-Punkte (Ø)
Platz 8 / 524 · in der MonkeyBench GPU-Rangliste

Weitere Benchmarks

Weitere Benchmarks für die Grafikkarte Gainward GeForce RTX 4080 SUPER Phoenix GS

Beliebte Vergleiche