


3DMark Benchmark (DirectX, Raytracing)
3DMark è un programma di benchmark che determina le prestazioni di alcuni componenti di un computer e quindi riporta le prestazioni come valore numerico.
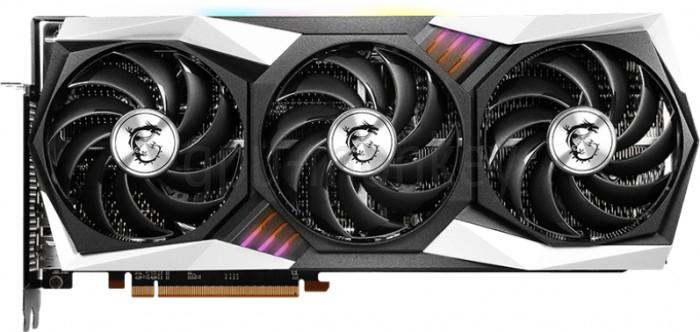
Qui puoi vedere quanto è veloce MSI Radeon RX 6800 XT Gaming Trio 16G in 3DMark Benchmark (DirectX, Raytracing). Le prestazioni della scheda grafica nei benchmark o nei giochi dipendono principalmente dall'architettura della GPU, dal numero di texture shader e dalla dimensione della memoria. MSI Radeon RX 6800 XT Gaming Trio 16G ha 16 GB GDDR6 di memoria.
3DMark è un programma di benchmark che determina le prestazioni di alcuni componenti di un computer e quindi riporta le prestazioni come valore numerico.


 Cyberpunk 2077MSI Radeon RX 6800 XT Gaming Trio 16G
 The Last of Us Part 1MSI Radeon RX 6800 XT Gaming Trio 16G
 GTA 5 BenchmarkMSI Radeon RX 6800 XT Gaming Trio 16G
 Shadow of the Tomb RaiderMSI Radeon RX 6800 XT Gaming Trio 16G
 Battlefield 5MSI Radeon RX 6800 XT Gaming Trio 16G
 Geekbench 6MSI Radeon RX 6800 XT Gaming Trio 16G
 Crypto-Mining Ethereum HashrateMSI Radeon RX 6800 XT Gaming Trio 16G
 Crypto-Mining Ergo HashrateMSI Radeon RX 6800 XT Gaming Trio 16G
 Crypto-Mining Ravencoin HashrateMSI Radeon RX 6800 XT Gaming Trio 16G
 Crypto-Mining Vertcoin HashrateMSI Radeon RX 6800 XT Gaming Trio 16G
 Prestazioni FP32MSI Radeon RX 6800 XT Gaming Trio 16G


