









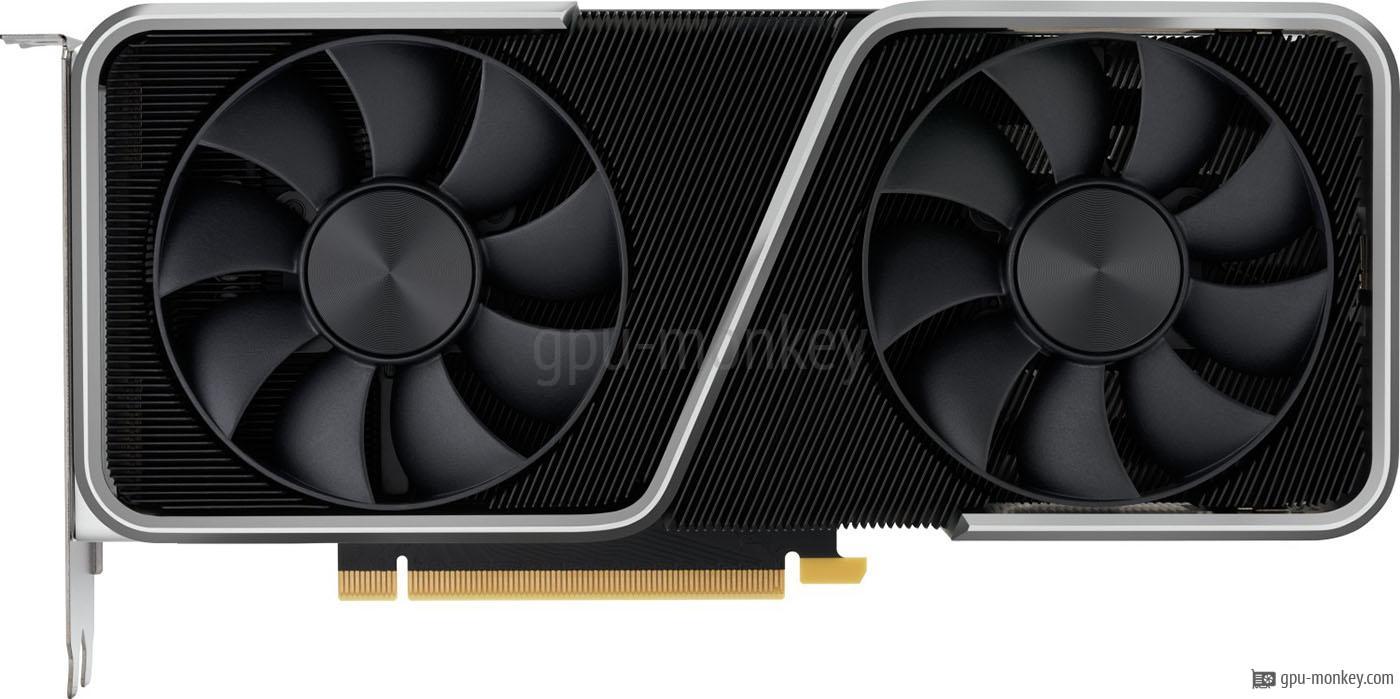
NVIDIA GeForce RTX 3050 OEM
NVIDIA 1 modelli Q1/2022

NVIDIA GeForce RTX 3050 OEM Lista GPU 2026

Elenchiamo 1 schede video basate sulla NVIDIA GeForce RTX 3050 OEM (GA106-150-KA-A1) con 8 GB GDDR6, con benchmark, frequenze e dati tecnici di tutti i modelli dei partner.

FP32
8,09TFLOPS
Frequenza turbo
1,76GHz
Memoria
8GB GDDR6
TDP
130W

GPU basate su NVIDIA GeForce RTX 3050 OEM

Tutti i modelli dei partner ordinati per prestazioni FP32. La percentuale indica lo scostamento del clock boost rispetto al design di riferimento.

GPUFP32Frequenza turboMemoriaTDP
8,11TFLOPS 1,76GHz 8GB 130W

Dettagli tecnici

GPU

GPU Chip
GA106-150-KA-A1 (Ampere)
Multiprocessori in streaming
18
Shader
2304
Render Output Units
32
Texture Units
72
Raytracing Cores
18
FP32
8,09 TFLOPS

Memoria

Dimensione della memoria
8 GB
Tipo di memoria
GDDR6
Orologio di memoria
1,750 GHz
Velocità
14,0 Gbps
Banda di memoria
224 GB/s
Interfaccia di memoria
128 bit

Velocità di clock

Frequenza di base
1,515 GHz
Frequenza turbo
1,755 GHz

Design termico

TDP
130 W
Tjunction max
93 °C
Interfaccia GPU
PCIe 4.0 x 16

Featureset

Max. Schermi
4
Max. risoluzione
7680x4320
DirectX
12_2 (Ultimate)
Raytracing
Si
DLSS / FSR
Si
Dimensioni della struttura
8 nm

Codec video supportati

h264
Decodificare / Codificare
h265 / HEVC
Decodificare / Codificare
VP8
Decodificare
VP9
Decodificare
AV1
Decodificare
Prezzo di rilascio
249 $

TOP 5 GPU nel gruppo per prestazioni FP32

  1. 1NVIDIA GeForce RTX 3050 (OEM)NVIDIA GeForce RTX 3050 (OEM)8 GB GDDR68,11TFLOPS

TOP 5 GPU nel gruppo per TDP massimo

  1. 1NVIDIA GeForce RTX 3050 (OEM)NVIDIA GeForce RTX 3050 (OEM)8 GB GDDR6130W

Risultati di benchmark

Media del gruppo GPU

3DMark Benchmark (DirectX, Raytracing)

3DMark è un programma di benchmark che determina le prestazioni di alcuni componenti di un computer e quindi riporta le prestazioni come valore numerico.

Time Spy Extreme Graphics score

  1. 2.675
  2. 2.582
  3. 2.481
  4. 2.476
  5. 2.447
  6. 2.279
  7. 2.251

Port Royal (Raytracing)

  1. 3.419
  2. 3.368
  3. 3.319
  4. 3.231
  5. 2.703
  6. NVIDIA TITAN XpNVIDIA TITAN Xp12 GB GDDR5X
    2.331
  7. 1.717

Speed Way Graphics Score (Raytracing)

  1. 1.421
  2. 1.344
  3. 1.326
  4. 1.268
  5. 1.164
  6. 141
  7. 80

Cyberpunk 2077

Cyberpunk 2077 è stato sviluppato da CD Projekt Red ed è basato sul REDengine 4 dello studio di sviluppo. Il ray tracing è disattivato nei nostri benchmark.

3840x2160 (2160p)

  1. 26 fps (avg)
  2. 24 fps (avg)
  3. 22 fps (avg)
  4. 22 fps (avg)
  5. 20 fps (avg)
  6. 20 fps (avg)
  7. 14 fps (avg)

2560x1440 (1440p)

  1. 31 fps (avg)
  2. 31 fps (avg)
  3. 28 fps (avg)
  4. 28 fps (avg)
  5. 24 fps (avg)
  6. 19 fps (avg)
  7. 11 fps (avg)

1920x1080 (1080p)

  1. 47 fps (avg)
  2. 42 fps (avg)
  3. 38 fps (avg)
  4. 38 fps (avg)
  5. 31 fps (avg)
  6. 21 fps (avg)

The Last of Us Part 1

The Last of Us Part One è un gioco pubblicato da Sony nel giugno 2013 esclusivamente per Playstation e rilasciato per PC all'inizio del 2023. I valori di riferimento qui sono stati determinati con dettagli elevati.

3840x2160 (2160p)

  1. 9 fps (avg)
  2. 9 fps (avg)
  3. 5 fps (avg)
  4. 4 fps (avg)

2560x1440 (1440p)

  1. 20 fps (avg)
  2. 20 fps (avg)
  3. 18 fps (avg)
  4. 15 fps (avg)

1920x1080 (1080p)

  1. 44 fps (avg)
  2. 44 fps (avg)
  3. 40 fps (avg)
  4. 40 fps (avg)
  5. 38 fps (avg)
  6. 36 fps (avg)
  7. 30 fps (avg)

Battlefield 5

Battlefield 5 è un gioco visivamente sbalorditivo, ideale come benchmark per le schede grafiche. Testiamo il gioco con i massimi dettagli su Windows 10.

3840x2160 (2160p)

  1. 33 fps (avg)
  2. 33 fps (avg)
  3. 30 fps (avg)
  4. 29 fps (avg)
  5. 28 fps (avg)
  6. 27 fps (avg)
  7. 27 fps (avg)

2560x1440 (1440p)

  1. 73 fps (avg)
  2. 73 fps (avg)
  3. 70 fps (avg)
  4. 65 fps (avg)
  5. 64 fps (avg)
  6. 63 fps (avg)
  7. 54 fps (avg)

1920x1080 (1080p)

  1. 93 fps (avg)
  2. 91 fps (avg)
  3. 88 fps (avg)
  4. 82 fps (avg)
  5. 82 fps (avg)
  6. 78 fps (avg)
  7. 75 fps (avg)

Geekbench 6 (OpenCL, Vulkan, Metal)

Geekbench 6 è un benchmark multipiattaforma per i processori principali, che esegue anche 3 diversi benchmark grafici e li emette sotto forma di un valore numerico.

Geekbench 6 - OpenCL

  1. 63.151
  2. 61.610
  3. 60.790
  4. 60.648
  5. 60.539
  6. 59.980
  7. 58.011

Geekbench 6 - Vulkan

  1. 58.164
  2. 56.917
  3. 56.876
  4. 56.286
  5. 55.921
  6. 55.474
  7. 55.359

MonkeyBench 2026.3 · test GPU nel browser

Media di 1 risultati pubblici MonkeyBench (WebGPU) per la NVIDIA GeForce RTX 3050 OEM.

179punti GPU (Ø)
Posizione 100 / 317 · nella classifica GPU di MonkeyBench

Alimentatori consigliati per questa scheda grafica

Alimentazione elettricaPotenzaPCIe 8-PinPrezzo di rilascio
500W 2x 159$
550W 2x 99$
550W 3x 100$
550W 2x 115$
550W 2x 129$
550W 2x 125$