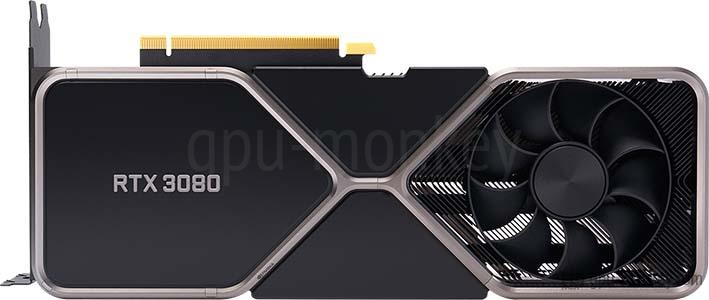
|
33,69TFLOPS |
1,94GHz+13 % |
10GB |
370W |
  |
|
33,69TFLOPS |
1,94GHz+13 % |
10GB |
370W |
|
|
33,69TFLOPS |
1,94GHz+13 % |
10GB |
370W |
|
|
33,43TFLOPS |
1,92GHz+12 % |
10GB |
370W |
|
|
33,16TFLOPS |
1,91GHz+11 % |
10GB |
370W |
|
|
33,16TFLOPS |
1,91GHz+11 % |
10GB |
370W |
|
|
32,38TFLOPS |
1,86GHz+9 % |
10GB |
370W |
|
|
32,38TFLOPS |
1,86GHz+9 % |
10GB |
340W |
|
|
32,12TFLOPS |
1,85GHz+8 % |
10GB |
320W |
|
|
32,12TFLOPS |
1,85GHz+8 % |
10GB |
320W |
|
|
32,12TFLOPS |
1,85GHz+8 % |
10GB |
320W |
|
|
32,12TFLOPS |
1,85GHz+8 % |
10GB |
320W |
|
|
31,86TFLOPS |
1,83GHz+7 % |
10GB |
370W |
|
|
31,86TFLOPS |
1,83GHz+7 % |
10GB |
370W |
|
|
31,60TFLOPS |
1,82GHz+6 % |
10GB |
340W |
|
|
31,60TFLOPS |
1,82GHz+6 % |
10GB |
320W |
|
|
31,60TFLOPS |
1,82GHz+6 % |
10GB |
340W |
|
|
31,34TFLOPS |
1,80GHz+5 % |
10GB |
370W |
|
|
31,34TFLOPS |
1,80GHz+5 % |
10GB |
320W |
|
|
31,34TFLOPS |
1,80GHz+5 % |
10GB |
320W |
|
|
31,34TFLOPS |
1,80GHz+5 % |
10GB |
320W |
|
|
31,34TFLOPS |
1,80GHz+5 % |
10GB |
320W |
|
|
31,34TFLOPS |
1,80GHz+5 % |
10GB |
320W |
|
|
31,34TFLOPS |
1,80GHz+5 % |
10GB |
320W |
|
|
31,08TFLOPS |
1,79GHz+4 % |
10GB |
370W |
|
|
31,08TFLOPS |
1,79GHz+4 % |
10GB |
370W |
|
|
30,81TFLOPS |
1,77GHz+4 % |
10GB |
320W |
|
|
30,81TFLOPS |
1,77GHz+4 % |
10GB |
320W |
|
|
30,81TFLOPS |
1,77GHz+4 % |
10GB |
320W |
|
|
30,81TFLOPS |
1,77GHz+4 % |
10GB |
340W |
|
|
30,81TFLOPS |
1,77GHz+4 % |
10GB |
340W |
|
|
30,81TFLOPS |
1,77GHz+4 % |
10GB |
340W |
|
|
30,81TFLOPS |
1,77GHz+4 % |
10GB |
320W |
|
|
30,81TFLOPS |
1,77GHz+4 % |
10GB |
320W |
|
|
30,81TFLOPS |
1,77GHz+4 % |
10GB |
320W |
|
|
30,81TFLOPS |
1,77GHz+4 % |
10GB |
370W |
|
|
30,81TFLOPS |
1,77GHz+4 % |
10GB |
340W |
|
|
30,55TFLOPS |
1,76GHz+3 % |
10GB |
340W |
|
|
30,55TFLOPS |
1,76GHz+3 % |
10GB |
340W |
|
|
30,55TFLOPS |
1,76GHz+3 % |
10GB |
320W |
|
|
30,55TFLOPS |
1,76GHz+3 % |
10GB |
320W |
|
|
30,55TFLOPS |
1,76GHz+3 % |
10GB |
320W |
|
|
30,55TFLOPS |
1,76GHz+3 % |
10GB |
320W |
|
|
30,55TFLOPS |
1,76GHz+3 % |
10GB |
340W |
|
|
30,55TFLOPS |
1,76GHz+3 % |
10GB |
320W |
|
|
30,55TFLOPS |
1,76GHz+3 % |
10GB |
340W |
|
|
30,55TFLOPS |
1,76GHz+3 % |
10GB |
340W |
|
|
30,55TFLOPS |
1,76GHz+3 % |
10GB |
340W |
|
|
30,29TFLOPS |
1,74GHz+2 % |
10GB |
320W |
|
|
30,29TFLOPS |
1,74GHz+2 % |
10GB |
370W |
|
|
30,29TFLOPS |
1,74GHz+2 % |
10GB |
370W |
|
|
30,29TFLOPS |
1,74GHz+2 % |
10GB |
340W |
|
|
30,29TFLOPS |
1,74GHz+2 % |
10GB |
320W |
|
|
30,29TFLOPS |
1,74GHz+2 % |
10GB |
320W |
|
|
30,29TFLOPS |
1,74GHz+2 % |
10GB |
320W |
|
|
30,29TFLOPS |
1,74GHz+2 % |
10GB |
320W |
|
|
30,29TFLOPS |
1,74GHz+2 % |
10GB |
320W |
|
|
30,03TFLOPS |
1,73GHz+1 % |
10GB |
320W |
|
|
30,03TFLOPS |
1,73GHz+1 % |
10GB |
320W |
|
|
30,03TFLOPS |
1,73GHz+1 % |
10GB |
320W |
|
|
30,03TFLOPS |
1,73GHz+1 % |
10GB |
320W |
|
|
30,03TFLOPS |
1,73GHz+1 % |
10GB |
320W |
|
|
29,77TFLOPS |
1,71GHz |
10GB |
320W |
|
|
29,77TFLOPS |
1,71GHz |
10GB |
320W |
|
|
29,77TFLOPS |
1,71GHz |
10GB |
320W |
|
|
29,77TFLOPS |
1,71GHz |
10GB |
320W |
|
|
29,77TFLOPS |
1,71GHz |
10GB |
320W |
|
|
29,77TFLOPS |
1,71GHz |
10GB |
320W |
|
|
29,77TFLOPS |
1,71GHz |
10GB |
320W |
|
|
29,77TFLOPS |
1,71GHz |
10GB |
320W |
|
|
29,77TFLOPS |
1,71GHz |
10GB |
320W |
|
|
29,77TFLOPS |
1,71GHz |
10GB |
320W |
|
|
29,77TFLOPS |
1,71GHz |
10GB |
320W |
|
|
29,77TFLOPS |
1,71GHz |
10GB |
320W |
|
|
29,77TFLOPS |
1,71GHz |
10GB |
320W |
|
|
29,77TFLOPS |
1,71GHz |
10GB |
320W |
|