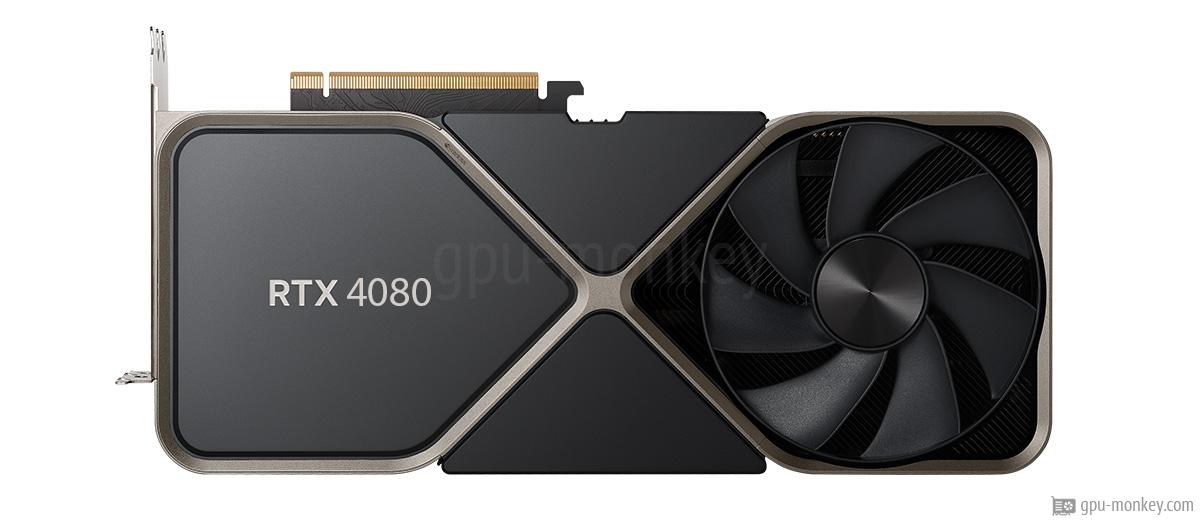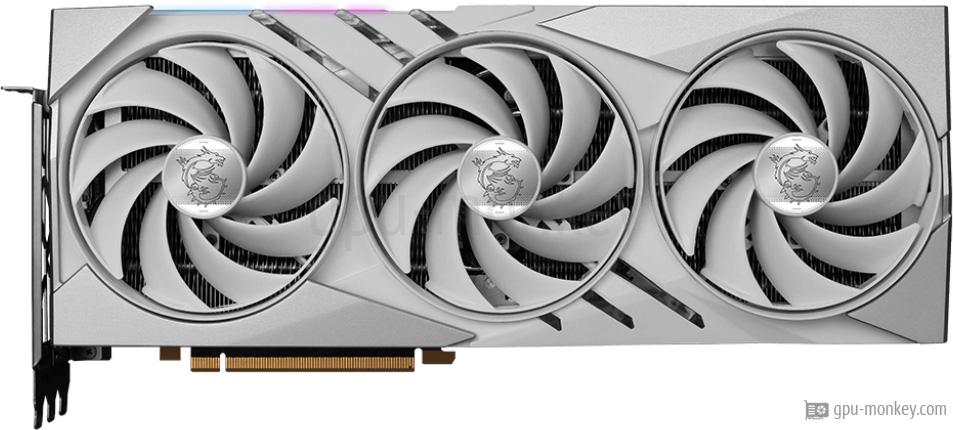







ZOTAC GAMING GeForce RTX 4080 SUPER Trinity OC White Edition

ZOTAC GAMING GeForce RTX 4080 SUPER Trinity OC White Edition ベンチマークと技術データ

ここでは、ZOTAC GAMING GeForce RTX 4080 SUPER Trinity OC White Edition のベンチマークと技術データを紹介します。 グラフィック カードは NVIDIA GeForce RTX 4080 SUPER (Ada Lovelace) に基づいており、16 GB GDDR6X グラフィック メモリと % のメモリ帯域幅を備えています。 736 GB/ 秒。 ZOTAC GAMING GeForce RTX 4080 SUPER Trinity OC White Edition には、10240 シェーダー を備えた 80 実行ユニット があります。
FP32
52.53TFLOPS
ターボ周波数
2.57GHz
ストレージ
16GB GDDR6X
TDP
320 W

技術データ

GPU

ZOTAC GAMING GeForce RTX 4080 SUPER Trinity OC White Edition には 10240 シェーダと 80 実行ユニットがあります。 したがって、グラフィックス カードは、52.53 TFLOPS の理論上の FP32 コンピューティング パワーを実現します。

GPU Chip
AD103-400-A1 (Ada Lovelace)
ストリーミング マルチプロセッサ
80
Shader
10240
Render Output Units
112
Texture Units
320
Raytracing Cores
80

ストレージ

ZOTAC GAMING GeForce RTX 4080 SUPER Trinity OC White Edition は、GDDR6X タイプの 16 GB グラフィックス メモリ を使用できます。 したがって、グラフィックス カードは、256 ビット幅のメモリ インターフェイスで 736 GB/s のメモリ帯域幅を実現します。

メモリー容量
16 GB
メモリ種別
GDDR6X
メモリクロック
1.438 GHz
スピード
23.0 Gbps
メモリ帯域幅
736 GB/s
メモリインターフェース
256 bit

クロック速度

ZOTAC GAMING GeForce RTX 4080 SUPER Trinity OC White Edition のベース クロック周波数は 2.295 GHz です。 クロック周波数が高いと (ターボ モードであっても)、グラフィックス カードの速度が大幅に向上します。

基本周波数
2.295 GHz
ターボ周波数
2.565 GHz+1 %
オーバークロック可能
はい

熱設計

ZOTAC GAMING GeForce RTX 4080 SUPER Trinity OC White Edition の TDP (熱設計電力) は 320 W です。 グラフィック カードには、1 x 16-Pin コネクタを介して電力が供給されます。

TDP
320 W
Tjunction max
90 °C
PCIe-Power
1 x 16-Pin

クーラー&ファン

ZOTAC GAMING GeForce RTX 4080 SUPER Trinity OC White Edition には、グラフィック プロセッサとグラフィック メモリを冷却するための合計 3 Axial ファンがあります。

ファンタイプ
Axial
ファン 1
3 x 90 mm
クーラータイプ
空冷
ボリューム(アイドル)
0 dB / サイレント

接続性

ZOTAC GAMING GeForce RTX 4080 SUPER Trinity OC White Edition には最大 4 画面まで接続できます。

最大画面
4
HDCP
2.3
HDMI
1x HDMI 2.1a
DisplayPort
3x DP 1.4a

機能セット

ZOTAC GAMING GeForce RTX 4080 SUPER Trinity OC White Edition の最大解像度は 7680x4320 ピクセルです。 グラフィック カードは DirectX 12_2 (Ultimate) 標準をサポートしています。

最大 解決
7680x4320
DirectX
12_2 (Ultimate)
Raytracing
はい
DLSS / FSR
はい
LED
ZOTAC SPECTRA

サポートされているビデオコーデック

ZOTAC GAMING GeForce RTX 4080 SUPER Trinity OC White Edition によってハードウェアで高速化されたビデオ コーデックは、プロセッサの負荷を軽減し、エネルギー消費を抑えます。

h264
復号化/符号化
h265 / HEVC
復号化/符号化
VP8
復号化
VP9
復号化
AV1
復号化

寸法

ZOTAC GAMING GeForce RTX 4080 SUPER Trinity OC White Edition の長さは 307 mm で、高さは 119 mm です。 幅が 59 mm のグラフィックス カードには、ケースに 3 PCIe-Slots が必要です。

長さ
307 mm
高さ
119 mm
幅
59 mm
幅(スロット)
3 PCIe-Slots
SFF-Ready
いいえ

追加データ

5 nm で作成された ZOTAC GAMING GeForce RTX 4080 SUPER Trinity OC White Edition は、Q1/2024 に 999 $ で公開されました。

GPUインターフェース
PCIe 4.0 x 16
リリース日
Q1/2024
発売価格
999 $ (参照)
構造サイズ
5 nm
商品番号
ZT-D40820Q-10P
ドキュメント
データシート
ZOTAC GAMING GeForce RTX 4080 SUPER Trinity OC White Edition
2.295 GHz · 16 GB · 320 W TDP
このグラフィックカードをAmazonから購入してください!

他のGPUと比較

モデル名を入力すると、比較ページが自動的に開きます。

このグラフィックス カードを評価する

ここでは、このグラフィックス カードを評価し、他の訪問者の購入決定に役立てることができます。 現在、このグラフィックス カードの平均評価は 0 星 (0 評価) です。 今すぐ自分で評価してください:

ベンチマーク

3DMark Benchmark (DirectX, Raytracing)

3DMark は、コンピューターの特定のコンポーネントのパフォーマンスを測定し、そのパフォーマンスを数値として報告するベンチマーク プログラムです。

Time Spy Extreme Graphics score 順位 329 / 5,633

  1. ZOTAC GAMING GeForce RTX 4080 SUPER Trinity OC White EditionZOTAC GAMING GeForce RTX 4080 SUPER Trinity OC White Edition16 GB GDDR6X
    14,105
  2. NVIDIA GeForce RTX 4080 SUPERNVIDIA GeForce RTX 4080 SUPERGPUグループの平均
    14,063

Steel Nomad Light Graphics score 順位 287 / 1,247

  1. ZOTAC GAMING GeForce RTX 4080 SUPER Trinity OC White EditionZOTAC GAMING GeForce RTX 4080 SUPER Trinity OC White Edition16 GB GDDR6X
    30,981
  2. NVIDIA GeForce RTX 4080 SUPERNVIDIA GeForce RTX 4080 SUPERGPUグループの平均
    30,889

Steel Nomad Graphics score 順位 289 / 1,247

  1. ZOTAC GAMING GeForce RTX 4080 SUPER Trinity OC White EditionZOTAC GAMING GeForce RTX 4080 SUPER Trinity OC White Edition16 GB GDDR6X
    7,273
  2. NVIDIA GeForce RTX 4080 SUPERNVIDIA GeForce RTX 4080 SUPERGPUグループの平均
    7,251

Port Royal (Raytracing) 順位 398 / 4,176

  1. ZOTAC GAMING GeForce RTX 4080 SUPER Trinity OC White EditionZOTAC GAMING GeForce RTX 4080 SUPER Trinity OC White Edition16 GB GDDR6X
    18,355
  2. NVIDIA GeForce RTX 4080 SUPERNVIDIA GeForce RTX 4080 SUPERGPUグループの平均
    18,301

Speed Way Graphics Score (Raytracing) 順位 386 / 3,536

  1. ZOTAC GAMING GeForce RTX 4080 SUPER Trinity OC White EditionZOTAC GAMING GeForce RTX 4080 SUPER Trinity OC White Edition16 GB GDDR6X
    7,461
  2. NVIDIA GeForce RTX 4080 SUPERNVIDIA GeForce RTX 4080 SUPERGPUグループの平均
    7,439

Solar Bay (Raytracing) 順位 322 / 1,247

  1. ZOTAC GAMING GeForce RTX 4080 SUPER Trinity OC White EditionZOTAC GAMING GeForce RTX 4080 SUPER Trinity OC White Edition16 GB GDDR6X
    138,809
  2. NVIDIA GeForce RTX 4080 SUPERNVIDIA GeForce RTX 4080 SUPERGPUグループの平均
    138,398

Cyberpunk 2077

『サイバーパンク 2077』は CD Projekt Red によって開発され、開発スタジオ独自の REDengine 4 に基づいています。 ベンチマークではレイ トレーシングはオフになっています。

3840x2160 (2160p) 順位 133 / 3,187

  1. ZOTAC GAMING GeForce RTX 4080 SUPER Trinity OC White EditionZOTAC GAMING GeForce RTX 4080 SUPER Trinity OC White Edition16 GB GDDR6X
    75 fps (avg)
  2. NVIDIA GeForce RTX 4080 SUPERNVIDIA GeForce RTX 4080 SUPERGPUグループの平均
    75 fps (avg)

2560x1440 (1440p) 順位 123 / 3,190

  1. ZOTAC GAMING GeForce RTX 4080 SUPER Trinity OC White EditionZOTAC GAMING GeForce RTX 4080 SUPER Trinity OC White Edition16 GB GDDR6X
    131 fps (avg)
  2. NVIDIA GeForce RTX 4080 SUPERNVIDIA GeForce RTX 4080 SUPERGPUグループの平均
    130 fps (avg)

1920x1080 (1080p) 順位 148 / 3,222

  1. ZOTAC GAMING GeForce RTX 4080 SUPER Trinity OC White EditionZOTAC GAMING GeForce RTX 4080 SUPER Trinity OC White Edition16 GB GDDR6X
    186 fps (avg)
  2. NVIDIA GeForce RTX 4080 SUPERNVIDIA GeForce RTX 4080 SUPERGPUグループの平均
    185 fps (avg)

The Last of Us Part 1

The Last of Us Part One は、ソニーが 2013 年 6 月にプレイステーション専用にリリースしたゲームで、2023 年初頭に PC 向けにリリースされました。 ここでのベンチマーク値は詳細に決定されました。

3840x2160 (2160p) 順位 123 / 2,190

  1. ZOTAC GAMING GeForce RTX 4080 SUPER Trinity OC White EditionZOTAC GAMING GeForce RTX 4080 SUPER Trinity OC White Edition16 GB GDDR6X
    59 fps (avg)
  2. NVIDIA GeForce RTX 4080 SUPERNVIDIA GeForce RTX 4080 SUPERGPUグループの平均
    59 fps (avg)

2560x1440 (1440p) 順位 113 / 2,709

  1. ZOTAC GAMING GeForce RTX 4080 SUPER Trinity OC White EditionZOTAC GAMING GeForce RTX 4080 SUPER Trinity OC White Edition16 GB GDDR6X
    114 fps (avg)
  2. NVIDIA GeForce RTX 4080 SUPERNVIDIA GeForce RTX 4080 SUPERGPUグループの平均
    113 fps (avg)

1920x1080 (1080p) 順位 139 / 2,843

  1. ZOTAC GAMING GeForce RTX 4080 SUPER Trinity OC White EditionZOTAC GAMING GeForce RTX 4080 SUPER Trinity OC White Edition16 GB GDDR6X
    155 fps (avg)
  2. NVIDIA GeForce RTX 4080 SUPERNVIDIA GeForce RTX 4080 SUPERGPUグループの平均
    154 fps (avg)

Battlefield 5

Battlefield 5 は、グラフィックス カードのベンチマークとして理想的な、視覚的に美しいゲームです。 Windows 10 上で最大限の詳細を備えたゲームをテストします。

3840x2160 (2160p) 順位 123 / 4,595

  1. ZOTAC GAMING GeForce RTX 4080 SUPER Trinity OC White EditionZOTAC GAMING GeForce RTX 4080 SUPER Trinity OC White Edition16 GB GDDR6X
    159 fps (avg)
  2. NVIDIA GeForce RTX 4080 SUPERNVIDIA GeForce RTX 4080 SUPERGPUグループの平均
    158 fps (avg)

2560x1440 (1440p) 順位 360 / 4,594

  1. ZOTAC GAMING GeForce RTX 4080 SUPER Trinity OC White EditionZOTAC GAMING GeForce RTX 4080 SUPER Trinity OC White Edition16 GB GDDR6X
    201 fps (avg)
  2. NVIDIA GeForce RTX 4080 SUPERNVIDIA GeForce RTX 4080 SUPERGPUグループの平均
    200 fps (avg)

1920x1080 (1080p) 順位 865 / 4,601

  1. ZOTAC GAMING GeForce RTX 4080 SUPER Trinity OC White EditionZOTAC GAMING GeForce RTX 4080 SUPER Trinity OC White Edition16 GB GDDR6X
    201 fps (avg)
  2. NVIDIA GeForce RTX 4080 SUPERNVIDIA GeForce RTX 4080 SUPERGPUグループの平均
    200 fps (avg)

Geekbench 6 (OpenCL, Vulkan, Metal)

Geekbench 6 は、メイン プロセッサ向けのクロスプラットフォーム ベンチマークで、3 つの異なるグラフィックス ベンチマークも実行し、数値の形式で出力します。

Geekbench 6 - OpenCL 順位 125 / 5,255

  1. ZOTAC GAMING GeForce RTX 4080 SUPER Trinity OC White EditionZOTAC GAMING GeForce RTX 4080 SUPER Trinity OC White Edition16 GB GDDR6X
    256,206
  2. NVIDIA GeForce RTX 4080 SUPERNVIDIA GeForce RTX 4080 SUPERGPUグループの平均
    254,694

Geekbench 6 - Vulkan 順位 138 / 5,233

  1. ZOTAC GAMING GeForce RTX 4080 SUPER Trinity OC White EditionZOTAC GAMING GeForce RTX 4080 SUPER Trinity OC White Edition16 GB GDDR6X
    220,548
  2. NVIDIA GeForce RTX 4080 SUPERNVIDIA GeForce RTX 4080 SUPERGPUグループの平均
    219,246

MonkeyBench 2026.3 · ブラウザGPUテスト

NVIDIA GeForce RTX 4080 SUPERの公開MonkeyBench結果(WebGPU)25件の平均。

978GPUポイント (Ø)
順位 8 / 524 · MonkeyBench GPUランキング内

その他のベンチマーク

グラフィックカードのその他のベンチマーク ZOTAC GAMING GeForce RTX 4080 SUPER Trinity OC White Edition

このグラフィックカードに推奨される電源

電源力PCIe 8-Pin発売価格
1000W 6x 189$

人気比較

1GIGABYTE GeForce RTX 4080 SUPER AERO OC 16G16 GB GDDR6X · 2.60 GHzZOTAC GAMING GeForce RTX 4080 SUPER Trinity OC White Edition16 GB GDDR6X · 2.57 GHz2MSI GeForce RTX 4080 SUPER 16G SUPRIM16 GB GDDR6X · 2.63 GHzZOTAC GAMING GeForce RTX 4080 SUPER Trinity OC White Edition16 GB GDDR6X · 2.57 GHz3ZOTAC GAMING GeForce RTX 4080 SUPER AMP Extreme AIRO16 GB GDDR6X · 2.61 GHzZOTAC GAMING GeForce RTX 4080 SUPER Trinity OC White Edition16 GB GDDR6X · 2.57 GHz4MSI GeForce RTX 4080 16GB GAMING X SLIM WHITE16 GB GDDR6X · 2.61 GHzZOTAC GAMING GeForce RTX 4080 SUPER Trinity OC White Edition16 GB GDDR6X · 2.57 GHz5NVIDIA GeForce RTX 4080 Founders Edition16 GB GDDR6X · 2.51 GHzZOTAC GAMING GeForce RTX 4080 SUPER Trinity OC White Edition16 GB GDDR6X · 2.57 GHz6ZOTAC GAMING GeForce RTX 4070 Ti SUPER Trinity OC White Edition16 GB GDDR6X · 2.63 GHzZOTAC GAMING GeForce RTX 4080 SUPER Trinity OC White Edition16 GB GDDR6X · 2.57 GHz7ZOTAC GAMING GeForce RTX 4080 SUPER Trinity OC White Edition16 GB GDDR6X · 2.57 GHzNVIDIA GeForce RTX 4060 Ti 16GB Founders Edition16 GB GDDR6 · 2.54 GHz8ZOTAC GAMING GeForce RTX 4070 Ti SUPER Solid OC16 GB GDDR6X · 2.64 GHzZOTAC GAMING GeForce RTX 4080 SUPER Trinity OC White Edition16 GB GDDR6X · 2.57 GHz9MSI GeForce RTX 4070 Ti SUPER 16G GAMING X SLIM WHITE16 GB GDDR6X · 2.69 GHzZOTAC GAMING GeForce RTX 4080 SUPER Trinity OC White Edition16 GB GDDR6X · 2.57 GHz10ZOTAC GAMING GeForce RTX 4080 SUPER Trinity OC White Edition16 GB GDDR6X · 2.57 GHzMSI GeForce RTX 4080 SUPER 16G GAMING X SLIM WHITE16 GB GDDR6X · 2.63 GHz