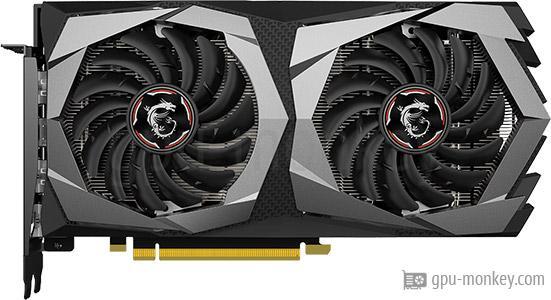
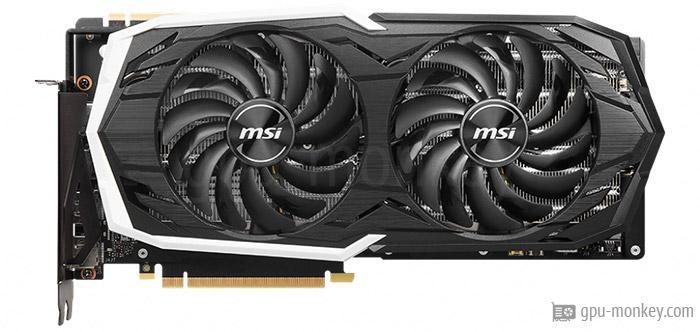
MSI GeForce GTX 1650 SUPER GAMING
vs
MSI GeForce RTX 2070 SUPER ARMOR
Confronto GPU con benchmarkNel confronto tra il MSI GeForce GTX 1650 SUPER GAMING e il MSI GeForce RTX 2070 SUPER ARMOR, confrontiamo sia i dati tecnici che i risultati del benchmark delle due schede grafiche.
|
||
GPUMSI GeForce GTX 1650 SUPER GAMING è basato su NVIDIA GeForce GTX 1650 SUPER e ha 1280 texture shader e 20 unità di esecuzione. MSI GeForce RTX 2070 SUPER ARMOR si basa su NVIDIA GeForce RTX 2070 SUPER, che ha 2560 shader e 40 unità di esecuzione. |
||
| MSI GeForce GTX 1650 SUPER GAMING | GPU | MSI GeForce RTX 2070 SUPER ARMOR |
| NVIDIA GeForce GTX 1650 SUPER | Basato su | NVIDIA GeForce RTX 2070 SUPER |
| TU116-250-KA-A1 | GPU Chip | TU104 |
| Turing | Architettura | Turing |
| 20 | Multiprocessori in streaming | 40 |
| 1280 | Shader | 2560 |
| 32 | Render Output Units | 64 |
| 80 | Texture Units | 160 |
| 0 | Raytracing Cores | 40 |
MemoriaIl MSI GeForce GTX 1650 SUPER GAMING ha 4 GB di memoria grafica del tipo GDDR6 e raggiunge una banda di memoria di 192 GB/s. MSI GeForce RTX 2070 SUPER ARMOR può accedere a 8 GB GDDR6 di memoria grafica e quindi raggiunge una larghezza di banda della memoria di 448 GB/s . |
||
| 4 GB | Dimensione della memoria | 8 GB |
| GDDR6 | Tipo di memoria | GDDR6 |
| 1,500 GHz | Orologio di memoria | 1,750 GHz |
| 12,0 Gbps | Velocità | 14,0 Gbps |
| 192 GB/s | Banda di memoria | 448 GB/s |
| 128 bit | Interfaccia di memoria | 256 bit |
Velocità di clockMSI GeForce GTX 1650 SUPER GAMING orologi nella base fino a 1,530 GHz. La frequenza base di MSI GeForce RTX 2070 SUPER ARMOR è 1,605 GHz. |
||
| 1,530 GHz | Frequenza di base | 1,605 GHz |
| 1,725 GHz | Frequenza turbo | 1,770 GHz |
| Frequenza media | ||
| Si | Overclocking | Si |
Design termicoIl TDP (Thermal Design Power) del MSI GeForce GTX 1650 SUPER GAMING è 100 W. La scheda grafica riceve energia tramite il connettore 1 x 6-Pin. Il MSI GeForce RTX 2070 SUPER ARMOR ha un TDP di 215 W e viene alimentato con l'energia necessaria tramite 1 x 6-Pin, 1 x 8-Pin connettori di alimentazione PCIe. |
||
| 100 W | TDP | 215 W |
| -- | TDP (up) | -- |
| 90 °C | Tjunction max | 88 °C |
| 1 x 6-Pin | PCIe-Power | 1 x 6-Pin, 1 x 8-Pin |
Dispositivo di raffreddamento e ventoleIl MSI GeForce GTX 1650 SUPER GAMING ha un totale di 2 Axial fan. Il MSI GeForce RTX 2070 SUPER ARMOR ha 2 Axial ventole per raffreddare la GPU e la memoria. |
||
| Axial | Tipo a ventaglio | Axial |
| 2 x 90 mm | Fan 1 | 2 x 100 mm |
| -- | Fan 2 | -- |
| Aria condizionata | Tipo di raffreddamento | Aria condizionata |
| dB | Volume (inattivo) | 0 dB |
| -- | Volume (pieno carico) | -- |
ConnettivitàNella categoria connettività, abbiamo registrato il numero di porte su una scheda grafica. È possibile collegare un totale di 3 schermi a MSI GeForce GTX 1650 SUPER GAMING. MSI GeForce RTX 2070 SUPER ARMOR supporta un massimo di 4 schermate. |
||
| 3 | Max. Schermi | 4 |
| 2.2 | HDCP-Version | 2.2 |
| 1x HDMI v2.0b | HDMI Ports | 1x HDMI v2.0b |
| 3x DP v1.4a | DP Ports | 3x DP v1.4a |
| -- | DVI Ports | -- |
| -- | VGA Ports | -- |
| -- | USB-C Ports | -- |
FeaturesetMSI GeForce GTX 1650 SUPER GAMING supporta una risoluzione massima di 7680x4320 pixel. La risoluzione massima di MSI GeForce RTX 2070 SUPER ARMOR è 7680x4320 pixel. |
||
| 7680x4320 | Max. risoluzione | 7680x4320 |
| 12_1 | DirectX | 12_2 (Ultimate) |
| No | Raytracing | Si |
| Si | DLSS / FSR | Si |
| MSI Mystic Light | LED | Nessuna illuminazione a LED |
Codec video supportatiIl supporto e l'accelerazione di determinati codec video direttamente nella scheda grafica riducono il carico durante la riproduzione o la creazione di video. |
||
| Decodificare / Codificare | h264 | Decodificare / Codificare |
| Decodificare / Codificare | h265 / HEVC | Decodificare / Codificare |
| No | AV1 | No |
| Decodificare | VP8 | Decodificare |
| Decodificare | VP9 | Decodificare |
DimensioniIl MSI GeForce GTX 1650 SUPER GAMING è 248 mm lungo, 127 mm alto e 44 mm largo. Il MSI GeForce RTX 2070 SUPER ARMOR è 297 mm lungo, 143 mm alto e 51 mm largo. |
||
| 248 mm | lunghezza | 297 mm |
| 127 mm | Altezza | 143 mm |
| 44 mm | Larghezza | 51 mm |
| 2 PCIe-Slots | Larghezza (slot) | 3 PCIe-Slots |
| -- | Peso | 1022 g |
| PCIe 3.0 x 16 | Interfaccia GPU | PCIe 3.0 x 16 |
Dati aggiuntiviIl MSI GeForce GTX 1650 SUPER GAMING è stato rilasciato in Q4/2019 al prezzo di 159 $ (Riferimento). Il MSI GeForce RTX 2070 SUPER ARMOR è stato introdotto in Q3/2019 al prezzo di 499 $ (Riferimento). |
||
| -- | codice articolo | -- |
| Q4/2019 | Data di lancio | Q3/2019 |
| 159 $ (Riferimento) | Prezzo di rilascio | 499 $ (Riferimento) |
| 12 nm | Dimensioni della struttura | 12 nm |
| scheda dati | Documenti | scheda dati |
Valuta subito queste schede grafiche
Risultati di benchmark
3DMark Benchmark (DirectX, Raytracing)
3DMark è un programma di benchmark che determina le prestazioni di alcuni componenti di un computer e quindi riporta le prestazioni come valore numerico.
Time Spy Extreme Graphics score
|
|
MSI GeForce GTX 1650 SUPER GAMING
4 GB GDDR6 |
||
|
|
MSI GeForce RTX 2070 SUPER ARMOR
8 GB GDDR6 |
||
Port Royal (Raytracing)
|
|
MSI GeForce RTX 2070 SUPER ARMOR
8 GB GDDR6 |
||
Speed Way Graphics Score (Raytracing)
|
|
MSI GeForce RTX 2070 SUPER ARMOR
8 GB GDDR6 |
||
Cyberpunk 2077
Cyberpunk 2077 è stato sviluppato da CD Projekt Red ed è basato sul REDengine 4 dello studio di sviluppo. Il ray tracing è disattivato nei nostri benchmark.
3840x2160 (2160p)
|
|
MSI GeForce RTX 2070 SUPER ARMOR
8 GB GDDR6 |
||
2560x1440 (1440p)
|
|
MSI GeForce RTX 2070 SUPER ARMOR
8 GB GDDR6 |
||
1920x1080 (1080p)
|
|
MSI GeForce RTX 2070 SUPER ARMOR
8 GB GDDR6 |
||
The Last of Us Part 1
The Last of Us Part One è un gioco pubblicato da Sony nel giugno 2013 esclusivamente per Playstation e rilasciato per PC all'inizio del 2023. I valori di riferimento qui sono stati determinati con dettagli elevati.
2560x1440 (1440p)
|
|
MSI GeForce RTX 2070 SUPER ARMOR
8 GB GDDR6 |
||
1920x1080 (1080p)
|
|
MSI GeForce GTX 1650 SUPER GAMING
4 GB GDDR6 |
||
|
|
MSI GeForce RTX 2070 SUPER ARMOR
8 GB GDDR6 |
||
Battlefield 5
Battlefield 5 è un gioco visivamente sbalorditivo, ideale come benchmark per le schede grafiche. Testiamo il gioco con i massimi dettagli su Windows 10.
3840x2160 (2160p)
|
|
MSI GeForce GTX 1650 SUPER GAMING
4 GB GDDR6 |
||
|
|
MSI GeForce RTX 2070 SUPER ARMOR
8 GB GDDR6 |
||
2560x1440 (1440p)
|
|
MSI GeForce GTX 1650 SUPER GAMING
4 GB GDDR6 |
||
|
|
MSI GeForce RTX 2070 SUPER ARMOR
8 GB GDDR6 |
||
1920x1080 (1080p)
|
|
MSI GeForce GTX 1650 SUPER GAMING
4 GB GDDR6 |
||
|
|
MSI GeForce RTX 2070 SUPER ARMOR
8 GB GDDR6 |
||
Geekbench 6 (OpenCL, Vulkan, Metal)
Geekbench 6 è un benchmark multipiattaforma per i processori principali, che esegue anche 3 diversi benchmark grafici e li emette sotto forma di un valore numerico.
Geekbench 6 - OpenCL
|
|
MSI GeForce GTX 1650 SUPER GAMING
4 GB GDDR6 |
||
|
|
MSI GeForce RTX 2070 SUPER ARMOR
8 GB GDDR6 |
||
Geekbench 6 - Vulkan
|
|
MSI GeForce GTX 1650 SUPER GAMING
4 GB GDDR6 |
||
|
|
MSI GeForce RTX 2070 SUPER ARMOR
8 GB GDDR6 |
||
Prestazioni FP32 (TFLOPS a precisione singola)
La potenza di calcolo teorica della scheda grafica con precisione singola (32 bit) in TFLOPS indica quanti trilioni di operazioni in virgola mobile FP32 la scheda grafica (GPU) può eseguire al secondo.
FP32 (TFLOPS)
|
|
MSI GeForce GTX 1650 SUPER GAMING
4 GB GDDR6 |
||
|
|
MSI GeForce RTX 2070 SUPER ARMOR
8 GB GDDR6 |
||


