

INNO3D GeForce RTX 3090 Ti 24GB X3 OC in 3DMark Benchmark (DirectX, Raytracing)
Here you can see how fast the INNO3D GeForce RTX 3090 Ti 24GB X3 OC is in 3DMark Benchmark (DirectX, Raytracing). The performance of the graphics card in benchmarks or games primarily depends on the GPU architecture, the number of texture shaders and the memory size. The INNO3D GeForce RTX 3090 Ti 24GB X3 OC has 24 GB GDDR6X memory.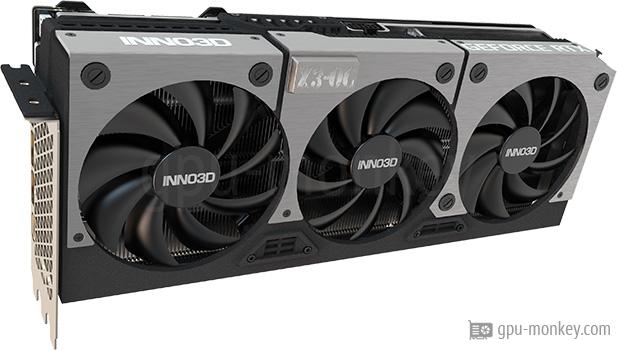
GPU |
|
| Based on: | NVIDIA GeForce RTX 3090 Ti |
| GPU Chip: | GA102-350-A1 (Ampere) |
| Streaming Multiprocessors: | 84 |
| Shader: | 10752 |
| Raytracing Cores: | 84 |
Memory |
|
| Memory Size: | 24 GB |
| Memory Type: | GDDR6X |
| Memory Clock: | 1.313 GHz |
| Memory bandwidth: | 1008 GB/s |
| Memory Interface: | 384 bit |
Benchmark results
3DMark Benchmark (DirectX, Raytracing)
3DMark is a benchmark program that determines the performance of certain components of a computer and then reports the performance as a numerical value.Time Spy Graphics score

|
INNO3D GeForce RTX 3090 Ti 24GB X3 OC
24 GB GDDR6X |
||

|
NVIDIA GeForce RTX 3090 Ti
Average of gpu group |
||
Time Spy Extreme Graphics score
|
|
INNO3D GeForce RTX 3090 Ti 24GB X3 OC
24 GB GDDR6X |
||
|
|
NVIDIA GeForce RTX 3090 Ti
Average of gpu group |
||
Fire Strike Extreme Graphics score
|
|
INNO3D GeForce RTX 3090 Ti 24GB X3 OC
24 GB GDDR6X |
||
|
|
NVIDIA GeForce RTX 3090 Ti
Average of gpu group |
||
Port Royal (Raytracing)
|
|
INNO3D GeForce RTX 3090 Ti 24GB X3 OC
24 GB GDDR6X |
||
|
|
NVIDIA GeForce RTX 3090 Ti
Average of gpu group |
||
Speed Way Graphics Score (Raytracing)
|
|
INNO3D GeForce RTX 3090 Ti 24GB X3 OC
24 GB GDDR6X |
||
|
|
NVIDIA GeForce RTX 3090 Ti
Average of gpu group |
||
More benchmarks for the graphics card
INNO3D GeForce RTX 3090 Ti 24GB X3 OC
In order to determine the performance of a graphics card, so-called "benchmarks" are carried out. The benchmark software carries out special calculations to determine the performance of a graphics card. We use so-called theoretical or synthetic benchmarks (e.g. 3D Mark) as well as real game benchmarks. To ensure real comparability of the results, we pay attention to the correct execution of the benchmarks as well as the condition of the graphics card and the system.We use the following benchmarks to measure the performance of a graphics card:

3DMark Benchmark
5,159 entries
5,159 entries

Cyberpunk 2077
2,942 entries
2,942 entries

The Last of Us Part 1
2,058 entries
2,058 entries

GTA 5 Benchmark
4,624 entries
4,624 entries

Shadow of the Tomb Raider
5,148 entries
5,148 entries

Battlefield 5
4,510 entries
4,510 entries

Geekbench 6
5,151 entries
5,151 entries

Crypto-Mining Ethereum Hashrate
3,506 entries
3,506 entries

Crypto-Mining Ergo Hashrate
3,737 entries
3,737 entries

Crypto-Mining Ravencoin Hashrate
3,664 entries
3,664 entries

FP32 Performance
5,522 entries
5,522 entries
GPUs by group
Here we have listed more GPU groups for you:
AMD Radeon RX 7600
8 GB GDDR6
8 GB GDDR6
AMD Radeon RX 7600 XT
16 GB GDDR6
16 GB GDDR6
AMD Radeon RX 7700 XT
12 GB GDDR6
12 GB GDDR6
AMD Radeon RX 7800 XT
16 GB GDDR6
16 GB GDDR6
AMD Radeon RX 7900 XT
20 GB GDDR6
20 GB GDDR6
AMD Radeon RX 7900 XTX
24 GB GDDR6
24 GB GDDR6
NVIDIA GeForce RTX 4060
8 GB GDDR6
8 GB GDDR6
NVIDIA GeForce RTX 4060 TI (16GB)
16 GB GDDR6
16 GB GDDR6
NVIDIA GeForce RTX 4060 TI (8GB)
8 GB GDDR6
8 GB GDDR6
NVIDIA GeForce RTX 4070
12 GB GDDR6X
12 GB GDDR6X
NVIDIA GeForce RTX 4070 SUPER
12 GB GDDR6X
12 GB GDDR6X
NVIDIA GeForce RTX 4070 Ti
12 GB GDDR6X
12 GB GDDR6X
NVIDIA GeForce RTX 4070 Ti SUPER
16 GB GDDR6X
16 GB GDDR6X
NVIDIA GeForce RTX 4080
16 GB GDDR6X
16 GB GDDR6X
NVIDIA GeForce RTX 4080 SUPER
16 GB GDDR6X
16 GB GDDR6X
NVIDIA GeForce RTX 4090
24 GB GDDR6X
24 GB GDDR6X

More GPU groups
show more results
show more results
back to index

