









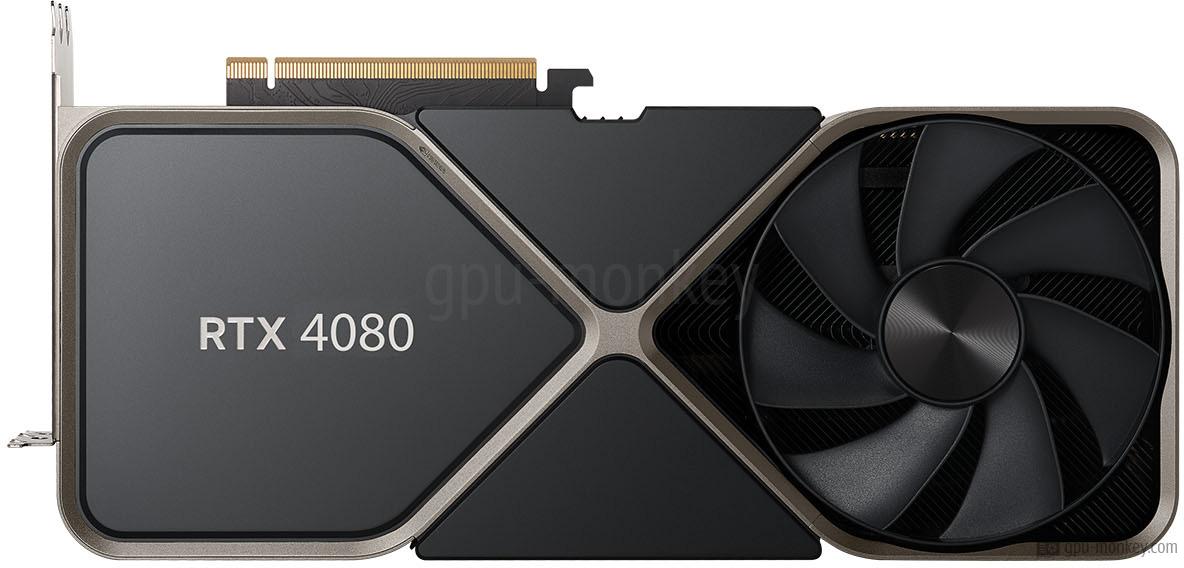
NVIDIA GeForce RTX 4080
NVIDIA 74 models Q4/2022

NVIDIA GeForce RTX 4080 GPU list 2026

We list 74 graphics cards based on the NVIDIA GeForce RTX 4080 (AD103-300-A1) with 16 GB GDDR6X – with benchmarks, clock speeds and technical data of all board partner models.

FP32
48.74TFLOPS
Boost Clock
2.51GHz
Memory
16GB GDDR6X
TDP
320W

GPUs based on NVIDIA GeForce RTX 4080

All board partner models sorted by FP32 performance. The percentage shows the deviation of the boost clock from the reference design.

Technical details

GPU

GPU Chip
AD103-300-A1 (Ada Lovelace)
Streaming Multiprocessors
76
Shader
9728
Render Output Units
112
Texture Units
304
Raytracing Cores
76
FP32
48.74 TFLOPS

Memory

Memory Size
16 GB
Memory Type
GDDR6X
Memory Clock
1.400 GHz
Memory Speed
22.4 Gbps
Memory bandwidth
717 GB/s
Memory Interface
256 bit

Clock Speeds

Base Clock
2.205 GHz
Boost Clock
2.505 GHz

Thermal Design

TDP
320 W
TDP (up)
355 W
Tjunction max
90 °C
GPU Interface
PCIe 4.0 x 16

Featureset

Max. Displays
4
Max. resolution
7680x4320
DirectX
12_2 (Ultimate)
Raytracing
Yes
DLSS / FSR
Yes
Structure size
5 nm

Supported Video Codecs

h264
Decode / Encode
h265 / HEVC
Decode / Encode
VP8
Decode
VP9
Decode
AV1
Decode
Launch Price
1,199 $

Benchmark results

Average of gpu group

3DMark Benchmark (DirectX, Raytracing)

3DMark is a benchmark program that determines the performance of certain components of a computer and then reports the performance as a numerical value.

Time Spy Extreme Graphics score

  1. 16,059
  2. 14,435
  3. 14,419
  4. 14,172
  5. 14,063
  6. 13,351
  7. 12,685

Steel Nomad Light Graphics score

  1. 43,163
  2. 34,689
  3. 30,889
  4. 29,602
  5. 28,968
  6. 25,806
  7. 22,608

Steel Nomad Graphics score

  1. 10,298
  2. 8,099
  3. 7,251
  4. 7,069
  5. 6,318
  6. 6,054
  7. 4,885

Port Royal (Raytracing)

  1. 20,019
  2. 18,769
  3. 18,301
  4. 18,146
  5. 16,158
  6. 15,463
  7. 14,488

Speed Way Graphics Score (Raytracing)

  1. 7,989
  2. 7,626
  3. 7,439
  4. 7,315
  5. 6,225
  6. 5,998
  7. 5,994

Solar Bay (Raytracing)

  1. 188,108
  2. 151,286
  3. 138,398
  4. 137,601
  5. 129,401
  6. 113,208
  7. 106,827

Cyberpunk 2077

Cyberpunk 2077 was developed by CD Projekt Red and is based on the development studio's own REDengine 4. Ray tracing is switched off in our benchmarks.

3840x2160 (2160p)

  1. 94 fps (avg)
  2. 75 fps (avg)
  3. 73 fps (avg)
  4. 70 fps (avg)
  5. 68 fps (avg)
  6. 66 fps (avg)

2560x1440 (1440p)

  1. 185 fps (avg)
  2. 130 fps (avg)
  3. 121 fps (avg)
  4. 118 fps (avg)
  5. 115 fps (avg)
  6. 108 fps (avg)

1920x1080 (1080p)

  1. 195 fps (avg)
  2. 185 fps (avg)
  3. 180 fps (avg)
  4. 176 fps (avg)
  5. 170 fps (avg)
  6. 160 fps (avg)

The Last of Us Part 1

The Last of Us Part One is a game released by Sony in June 2013 exclusively for the Playstation and released for the PC in early 2023. The benchmark values here were determined at high details.

3840x2160 (2160p)

  1. 80 fps (avg)
  2. 59 fps (avg)
  3. 54 fps (avg)
  4. 52 fps (avg)
  5. 50 fps (avg)
  6. 49 fps (avg)

2560x1440 (1440p)

  1. 142 fps (avg)
  2. 113 fps (avg)
  3. 108 fps (avg)
  4. 100 fps (avg)
  5. 97 fps (avg)
  6. 95 fps (avg)

1920x1080 (1080p)

  1. 184 fps (avg)
  2. 154 fps (avg)
  3. 150 fps (avg)
  4. 148 fps (avg)
  5. 144 fps (avg)
  6. 142 fps (avg)
  7. 142 fps (avg)

Battlefield 5

Battlefield 5 is a visually stunning game that is ideal as a graphics card benchmark. We test the game with maximum details on Windows 10.

3840x2160 (2160p)

  1. 132 fps (avg)
  2. 128 fps (avg)
  3. 125 fps (avg)
  4. 123 fps (avg)
  5. 122 fps (avg)
  6. 116 fps (avg)
  7. 114 fps (avg)

2560x1440 (1440p)

  1. 179 fps (avg)
  2. 178 fps (avg)
  3. 172 fps (avg)
  4. 165 fps (avg)
  5. 162 fps (avg)
  6. 162 fps (avg)
  7. 156 fps (avg)

1920x1080 (1080p)

  1. 190 fps (avg)
  2. 190 fps (avg)
  3. 190 fps (avg)
  4. 188 fps (avg)
  5. 188 fps (avg)
  6. 188 fps (avg)
  7. 188 fps (avg)

Geekbench 6 (OpenCL, Vulkan, Metal)

Geekbench 6 is a cross-platform benchmark for main processors, which also carries out 3 different graphics benchmarks and outputs them in the form of a numerical value.

Geekbench 6 - OpenCL

  1. 349,582
  2. 286,853
  3. 254,694
  4. 254,310
  5. 229,323
  6. 222,679
  7. 211,223

Geekbench 6 - Vulkan

  1. 172,489
  2. 159,473
  3. 157,857
  4. 155,939
  5. 152,394
  6. 146,797
  7. 146,648

MonkeyBench 2026.3 · browser GPU test

Average of 9 public MonkeyBench results (WebGPU) for the NVIDIA GeForce RTX 4080.

941GPU points (Ø)
Rank 9 / 388 · in the MonkeyBench GPU ranking