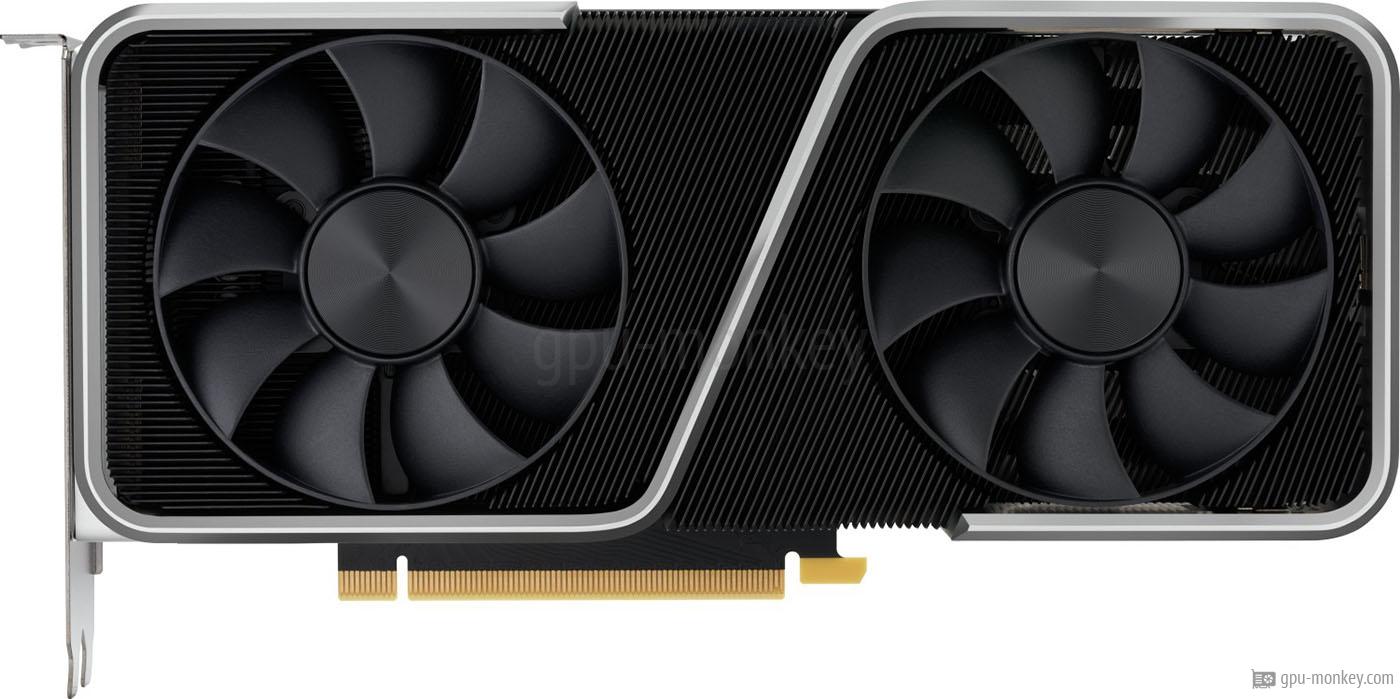
NVIDIA GeForce RTX 3050 (OEM)
Benchmark and Specs

Last updated:

Description

Here we show you benchmarks and technical data for the NVIDIA GeForce RTX 3050 (OEM). The graphics card is based on the NVIDIA GeForce RTX 3050 OEM (Ampere) and has 8 GB GDDR6 of graphics memory with a bandwidth of 224 GB/s.

The total 2304 shader units of the NVIDIA GeForce RTX 3050 (OEM) are clocked with a maximum of 1.76 GHz. The graphics card thus achieves an FP32 computing power of 8.09 TFLOPS and was released in Q1/2022.

GPU

Based on: NVIDIA GeForce RTX 3050 OEM
GPU Chip: GA106-150-KA-A1 (Ampere)
Execution units: 18
Shader: 2304
Render Output Units: 32
Texture Units: 72
Raytracing Cores: 18

Memory

Memory Size: 8 GB
Memory Type: GDDR6
Memory Clock: 1.750 GHz
Memory Speed: 14 Gbps
Memory Bandwith: 224 GB/s
Memory Interface: 128 bit

Clock Speeds

Base Clock: 1.510 GHz
Boost Clock: 1.760 GHz
Avg (Game) Clock:
Overclocking: Yes

Thermal Design

TDP: 130 W
TDP (up): --
Tjunction max: 93 °C
PCIe-Power: 1 x 8-Pin

Cooler & Fans

Fan-Type: Axial
Fan 1: --
Fan 2: --
Cooler-Type: Air cooling
Noise (Idle): 0 dB / Silent
Noise (Load): --

Connectivity

Max. Displays: 4
HDCP-Version: 2.3
HDMI Ports: 1x HDMI v2.1
DP Ports: 2x DP v1.4a
DVI Ports: --
VGA Ports: --
USB-C Ports: --

Featureset

Max. resolution: 7680x4320
DirectX: 12_2 (Ultimate)
Raytracing: Yes
DLSS / FSR: Yes
LED: No LED lighting

Supported Video Codecs

h264: Decode / Encode
h265 / HEVC: Decode / Encode
VP8: Decode
VP9: Decode
AV1: Decode

Dimensions

Length: --
Height: --
Width: --
Width (Slots): --
Weight: --

Additional data

GPU Interface: PCIe 4.0 x 16
Release date: Q1/2022
Launch Price: 249 $ (Reference)
Structure size: 8 nm
Part-no: --
Documents: data sheet

Benchmark results

FP32 Performance (Single-precision TFLOPS) - FP32 (TFLOPS)

The theoretical computing power of the graphics card with single precision (32 bit) in TFLOPS. TFLOPS indicates how many trillion FP32 floating point operations the graphics card (GPU) can perform per second. The larger this number, the faster the graphics card is.

View all FP32 Performance (Single-precision TFLOPS) benchmark results


3DMark Benchmark (DirectX, Raytracing) - Time Spy Graphics score

3DMark is a benchmark program that determines the performance of certain components of a computer and then reports the performance as a numerical value. Here at GPU-Monkey we only use selected benchmarks for the graphics card, which are determined with a sufficiently fast processor so that the processor does not negatively affect the performance of the graphics card.
View all 3DMark Benchmark (DirectX, Raytracing) benchmark results


3DMark Benchmark (DirectX, Raytracing) - Time Spy Extreme Graphics score

3DMark is a benchmark program that determines the performance of certain components of a computer and then reports the performance as a numerical value. Here at GPU-Monkey we only use selected benchmarks for the graphics card, which are determined with a sufficiently fast processor so that the processor does not negatively affect the performance of the graphics card.
View all 3DMark Benchmark (DirectX, Raytracing) benchmark results


3DMark Benchmark (DirectX, Raytracing) - Fire Strike Extreme Graphics score

3DMark is a benchmark program that determines the performance of certain components of a computer and then reports the performance as a numerical value. Here at GPU-Monkey we only use selected benchmarks for the graphics card, which are determined with a sufficiently fast processor so that the processor does not negatively affect the performance of the graphics card.
View all 3DMark Benchmark (DirectX, Raytracing) benchmark results


3DMark Benchmark (DirectX, Raytracing) - Port Royal (Raytracing)

3DMark is a benchmark program that determines the performance of certain components of a computer and then reports the performance as a numerical value. Here at GPU-Monkey we only use selected benchmarks for the graphics card, which are determined with a sufficiently fast processor so that the processor does not negatively affect the performance of the graphics card.
View all 3DMark Benchmark (DirectX, Raytracing) benchmark results


3DMark Benchmark (DirectX, Raytracing) - Speed Way Graphics Score (Raytracing)

3DMark is a benchmark program that determines the performance of certain components of a computer and then reports the performance as a numerical value. Here at GPU-Monkey we only use selected benchmarks for the graphics card, which are determined with a sufficiently fast processor so that the processor does not negatively affect the performance of the graphics card.
View all 3DMark Benchmark (DirectX, Raytracing) benchmark results


Geekbench 5 (CUDA, OpenCL, Vulkan, Metal) - Geekbench 5 - CUDA (NVIDIA only)

Geekbench 5 is primarily a cross-platform benchmark for main processors, which runs through various tests in order to finally output the processor's performance in the form of a numerical value. In addition to the CPU benchmark, Geekbench can also run 4 different graphics benchmarks and output them in the form of a numerical value.
Zusätzlich zum CPU-Benchmark kann Geekbench auch 4 verschiedene Grafik-Benchmarks durchführen und in Form eines Zahlenwertes ausgeben.
View all Geekbench 5 (CUDA, OpenCL, Vulkan, Metal) benchmark results


Geekbench 5 (CUDA, OpenCL, Vulkan, Metal) - Geekbench 5 - OpenCL

Geekbench 5 is primarily a cross-platform benchmark for main processors, which runs through various tests in order to finally output the processor's performance in the form of a numerical value. In addition to the CPU benchmark, Geekbench can also run 4 different graphics benchmarks and output them in the form of a numerical value.
Zusätzlich zum CPU-Benchmark kann Geekbench auch 4 verschiedene Grafik-Benchmarks durchführen und in Form eines Zahlenwertes ausgeben.
View all Geekbench 5 (CUDA, OpenCL, Vulkan, Metal) benchmark results


Geekbench 5 (CUDA, OpenCL, Vulkan, Metal) - Geekbench 5 - Vulkan

Geekbench 5 is primarily a cross-platform benchmark for main processors, which runs through various tests in order to finally output the processor's performance in the form of a numerical value. In addition to the CPU benchmark, Geekbench can also run 4 different graphics benchmarks and output them in the form of a numerical value.
Zusätzlich zum CPU-Benchmark kann Geekbench auch 4 verschiedene Grafik-Benchmarks durchführen und in Form eines Zahlenwertes ausgeben.
View all Geekbench 5 (CUDA, OpenCL, Vulkan, Metal) benchmark results


Battlefield 5 - 3840x2160 (2160p)

Battlefield 5 is a visually impressive game. It uses the third version of the "Frostbite Game Engine" developed by the manufacturer DICE. The engine is available for Windows, PS4, PS5, XBox One or XBox Series X. Many physics-based calculations are carried out directly in the game engine, which results in very realistic calculations. Due to its current features, Battlefield 5 is very suitable as a graphics card benchmark.

Test environment and settings: DirectX 12 API with max. Details, tested under Windows 10.
AMD Radeon RX 5500 XT AMD Radeon RX 5500 XT
4 GB GDDR6
33 fps (avg)
NVIDIA GeForce GTX 1060 5GB NVIDIA GeForce GTX 1060 5GB
5 GB GDDR5
30 fps (avg)
NVIDIA GeForce RTX 3050 (OEM) NVIDIA GeForce RTX 3050 (OEM)
8 GB GDDR6
29 fps (avg)
NVIDIA GeForce RTX 3050 OEM NVIDIA GeForce RTX 3050 OEM
8 GB GDDR6
29 fps (avg)
NVIDIA GeForce GTX 1060 6GB (GDDR5X) NVIDIA GeForce GTX 1060 6GB (GDDR5X)
6 GB GDDR5X
28 fps (avg)
NVIDIA GeForce GTX 1060 6GB NVIDIA GeForce GTX 1060 6GB
6 GB GDDR5
27 fps (avg)
AMD Radeon RX 6500 XT AMD Radeon RX 6500 XT
4 GB GDDR6
27 fps (avg)
View all Battlefield 5 benchmark results


Battlefield 5 - 2560x1440 (1440p)

Battlefield 5 is a visually impressive game. It uses the third version of the "Frostbite Game Engine" developed by the manufacturer DICE. The engine is available for Windows, PS4, PS5, XBox One or XBox Series X. Many physics-based calculations are carried out directly in the game engine, which results in very realistic calculations. Due to its current features, Battlefield 5 is very suitable as a graphics card benchmark.

Test environment and settings: DirectX 12 API with max. Details, tested under Windows 10.
NVIDIA GeForce RTX 3050 NVIDIA GeForce RTX 3050
8 GB GDDR6
73 fps (avg)
AMD Radeon RX 580 (36 CU) AMD Radeon RX 580 (36 CU)
8 GB GDDR5
70 fps (avg)
NVIDIA GeForce RTX 3050 (OEM) NVIDIA GeForce RTX 3050 (OEM)
8 GB GDDR6
65 fps (avg)
NVIDIA GeForce RTX 3050 OEM NVIDIA GeForce RTX 3050 OEM
8 GB GDDR6
65 fps (avg)
AMD Radeon RX 5500 XT AMD Radeon RX 5500 XT
4 GB GDDR6
64 fps (avg)
NVIDIA GeForce GTX 1650 SUPER NVIDIA GeForce GTX 1650 SUPER
4 GB GDDR6
63 fps (avg)
NVIDIA GeForce GTX 1060 5GB NVIDIA GeForce GTX 1060 5GB
5 GB GDDR5
54 fps (avg)
View all Battlefield 5 benchmark results


Battlefield 5 - 1920x1080 (1080p)

Battlefield 5 is a visually impressive game. It uses the third version of the "Frostbite Game Engine" developed by the manufacturer DICE. The engine is available for Windows, PS4, PS5, XBox One or XBox Series X. Many physics-based calculations are carried out directly in the game engine, which results in very realistic calculations. Due to its current features, Battlefield 5 is very suitable as a graphics card benchmark.

Test environment and settings: DirectX 12 API with max. Details, tested under Windows 10.
NVIDIA GeForce GTX 1660 NVIDIA GeForce GTX 1660
6 GB GDDR5
91 fps (avg)
AMD Radeon RX 5500 XT AMD Radeon RX 5500 XT
4 GB GDDR6
88 fps (avg)
NVIDIA GeForce RTX 3050 (OEM) NVIDIA GeForce RTX 3050 (OEM)
8 GB GDDR6
82 fps (avg)
NVIDIA GeForce RTX 3050 OEM NVIDIA GeForce RTX 3050 OEM
8 GB GDDR6
82 fps (avg)
NVIDIA GeForce GTX 1650 SUPER NVIDIA GeForce GTX 1650 SUPER
4 GB GDDR6
82 fps (avg)
AMD Radeon RX 580 (32 CU) AMD Radeon RX 580 (32 CU)
4 GB GDDR5
78 fps (avg)
NVIDIA GeForce GTX 1060 6GB (GDDR5X) NVIDIA GeForce GTX 1060 6GB (GDDR5X)
6 GB GDDR5X
75 fps (avg)
View all Battlefield 5 benchmark results


Shadow of the Tomb Raider - 3840x2160 (2160p)

Shadow of the Tomb Raider is based on a modified version of the Crystal Dynamics Foundation engine. This engine was already used in the predecessor Rise of the Tomb Raider. The foundation engine supports a realistic representation of water and snow and shows the game characters detailed. The display of hair is also very realistic thanks to the support of TressFX (AMD) or HairWorks (NVIDIA).
AMD Radeon RX 5500 XT AMD Radeon RX 5500 XT
4 GB GDDR6
22 fps (avg)
NVIDIA GeForce RTX 3050 (OEM) NVIDIA GeForce RTX 3050 (OEM)
8 GB GDDR6
20 fps (avg)
NVIDIA GeForce GTX 980 NVIDIA GeForce GTX 980
4 GB GDDR5
20 fps (avg)
NVIDIA GeForce RTX 3050 OEM NVIDIA GeForce RTX 3050 OEM
8 GB GDDR6
20 fps (avg)
NVIDIA GeForce GTX 1650 SUPER NVIDIA GeForce GTX 1650 SUPER
4 GB GDDR6
19 fps (avg)
AMD Radeon RX 570 AMD Radeon RX 570
4 GB GDDR5
17 fps (avg)
AMD Radeon RX 580 (32 CU) AMD Radeon RX 580 (32 CU)
4 GB GDDR5
17 fps (avg)
View all Shadow of the Tomb Raider benchmark results


Shadow of the Tomb Raider - 2560x1440 (1440p)

Shadow of the Tomb Raider is based on a modified version of the Crystal Dynamics Foundation engine. This engine was already used in the predecessor Rise of the Tomb Raider. The foundation engine supports a realistic representation of water and snow and shows the game characters detailed. The display of hair is also very realistic thanks to the support of TressFX (AMD) or HairWorks (NVIDIA).
NVIDIA GeForce GTX 1660 SUPER NVIDIA GeForce GTX 1660 SUPER
6 GB GDDR6
51 fps (avg)
NVIDIA GeForce RTX 3050 (OEM) NVIDIA GeForce RTX 3050 (OEM)
8 GB GDDR6
50 fps (avg)
NVIDIA RTX A2000 NVIDIA RTX A2000
6 GB GDDR6
50 fps (avg)
NVIDIA GeForce RTX 3050 OEM NVIDIA GeForce RTX 3050 OEM
8 GB GDDR6
50 fps (avg)
NVIDIA GeForce GTX 1070 NVIDIA GeForce GTX 1070
8 GB GDDR5
50 fps (avg)
NVIDIA GeForce GTX 1660 NVIDIA GeForce GTX 1660
6 GB GDDR5
47 fps (avg)
Intel Arc A580 Graphics Intel Arc A580 Graphics
8 GB GDDR6
45 fps (avg)
View all Shadow of the Tomb Raider benchmark results


Shadow of the Tomb Raider - 1920x1080 (1080p)

Shadow of the Tomb Raider is based on a modified version of the Crystal Dynamics Foundation engine. This engine was already used in the predecessor Rise of the Tomb Raider. The foundation engine supports a realistic representation of water and snow and shows the game characters detailed. The display of hair is also very realistic thanks to the support of TressFX (AMD) or HairWorks (NVIDIA).
NVIDIA GeForce RTX 3050 (OEM) NVIDIA GeForce RTX 3050 (OEM)
8 GB GDDR6
70 fps (avg)
NVIDIA RTX A2000 NVIDIA RTX A2000
6 GB GDDR6
70 fps (avg)
NVIDIA GeForce RTX 3050 OEM NVIDIA GeForce RTX 3050 OEM
8 GB GDDR6
70 fps (avg)
Intel Arc A580 Graphics Intel Arc A580 Graphics
8 GB GDDR6
70 fps (avg)
AMD Radeon RX 590 AMD Radeon RX 590
8 GB GDDR5
69 fps (avg)
NVIDIA GeForce GTX 980 Ti NVIDIA GeForce GTX 980 Ti
6 GB GDDR5
65 fps (avg)
AMD Radeon RX 5500 XT AMD Radeon RX 5500 XT
4 GB GDDR6
63 fps (avg)
View all Shadow of the Tomb Raider benchmark results


More benchmarks

In order to determine the performance of a graphics card, so-called "benchmarks" are carried out. The benchmark software carries out special calculations to determine the performance of a graphics card. We use so-called theoretical or synthetic benchmarks (e.g. 3D Mark) as well as real game benchmarks. To ensure real comparability of the results, we pay attention to the correct execution of the benchmarks as well as the condition of the graphics card and the system.

We use the following benchmarks to measure the performance of a graphics card:

Recommended power supplies for this graphics card

Power Supply PCIe 8 Pin (6+2) Launch Price
Seasonic PRIME FANLESS PX-500 Seasonic PRIME FANLESS PX-500 - 500 W 2 x 159 $
Corsair TX-M Series TX550M 2017 Corsair TX-M Series TX550M 2017 - 550 W 2 x 99 $
EVGA SuperNOVA 550 G3 EVGA SuperNOVA 550 G3 - 550 W 3 x 100 $
be quiet! Straight Power 11 be quiet! Straight Power 11 - 550 W 2 x 115 $
be quiet! Straight Power 11 Platinum be quiet! Straight Power 11 Platinum - 550 W 2 x 125 $
EVGA SuperNOVA 550 GA EVGA SuperNOVA 550 GA - 550 W 3 x 120 $
be quiet! Pure Power 11 FM be quiet! Pure Power 11 FM - 550 W 2 x 89 $
Corsair TX-M Series TX550M 2021 Corsair TX-M Series TX550M 2021 - 550 W 2 x 82 $
Corsair RMx Series RM550x 2021 Corsair RMx Series RM550x 2021 - 550 W 2 x 119 $
Seasonic G12 GC-550 Seasonic G12 GC-550 - 550 W 2 x 62 $


Popular comparisons

1. NVIDIA GeForce GTX 1660 SUPER NVIDIA GeForce RTX 3050 (OEM) NVIDIA GeForce GTX 1660 SUPER vs NVIDIA GeForce RTX 3050 (OEM)
2. NVIDIA GeForce RTX 3050 (OEM) NVIDIA GeForce RTX 3060 NVIDIA GeForce RTX 3050 (OEM) vs NVIDIA GeForce RTX 3060
3. NVIDIA GeForce RTX 3050 (OEM) PNY GeForce GTX 1070 Ti Blower NVIDIA GeForce RTX 3050 (OEM) vs PNY GeForce GTX 1070 Ti Blower
4. MSI Radeon RX 5700 Evoke NVIDIA GeForce RTX 3050 (OEM) MSI Radeon RX 5700 Evoke vs NVIDIA GeForce RTX 3050 (OEM)
5. NVIDIA GeForce RTX 3050 (OEM) NVIDIA GeForce RTX 3060 Laptop (Mobile) - 80 W NVIDIA GeForce RTX 3050 (OEM) vs NVIDIA GeForce RTX 3060 Laptop (Mobile) - 80 W
6. NVIDIA GeForce RTX 3050 NVIDIA GeForce RTX 3050 (OEM) NVIDIA GeForce RTX 3050 vs NVIDIA GeForce RTX 3050 (OEM)
7. NVIDIA TITAN V CEO Edition NVIDIA GeForce RTX 3050 (OEM) NVIDIA TITAN V CEO Edition vs NVIDIA GeForce RTX 3050 (OEM)
8. ASUS Dual GeForce RTX 2070 NVIDIA GeForce RTX 3050 (OEM) ASUS Dual GeForce RTX 2070 vs NVIDIA GeForce RTX 3050 (OEM)
9. GIGABYTE GeForce RTX 3060 Vision OC 12G NVIDIA GeForce RTX 3050 (OEM) GIGABYTE GeForce RTX 3060 Vision OC 12G vs NVIDIA GeForce RTX 3050 (OEM)
10. EVGA GeForce GTX 1660 SUPER SC ULTRA GAMING NVIDIA GeForce RTX 3050 (OEM) EVGA GeForce GTX 1660 SUPER SC ULTRA GAMING vs NVIDIA GeForce RTX 3050 (OEM)


back to index
Facebook
Twitter