








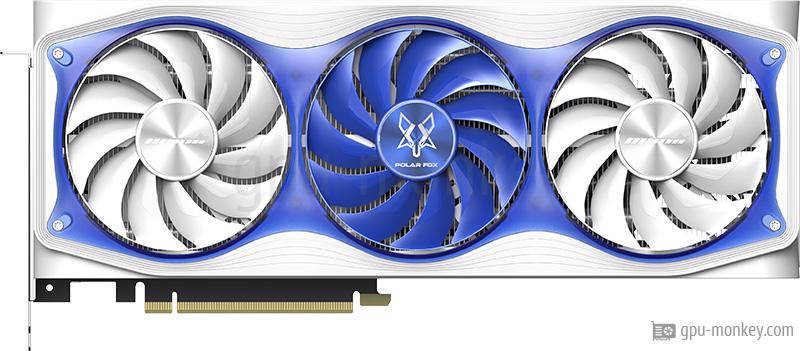
Manli Polar Fox GeForce RTX 5080 OC

Manli Polar Fox GeForce RTX 5080 OC in 3DMark Benchmark (DirectX, Raytracing)

Here you can see how fast the Manli Polar Fox GeForce RTX 5080 OC is in 3DMark Benchmark (DirectX, Raytracing). The performance of the graphics card in benchmarks or games primarily depends on the GPU architecture, the number of texture shaders and the memory size. The Manli Polar Fox GeForce RTX 5080 OC has 16 GB GDDR7 memory.

Boost Clock
2.64GHz
Memory
16GB GDDR7
Shader
10752
Memory bandwidth
960GB/s

3DMark Benchmark (DirectX, Raytracing)

3DMark is a benchmark program that determines the performance of certain components of a computer and then reports the performance as a numerical value.
Time Spy Graphics score Rank 212 / 5,638

  1. 32,248
  2. 32,248
  3. 32,248
  4. 32,248
  5. 32,248
  6. 32,248
  7. 32,248

Time Spy Extreme Graphics score Rank 212 / 5,633

  1. 16,129
  2. 16,129
  3. 16,129
  4. 16,129
  5. 16,129
  6. 16,129
  7. 16,129

Steel Nomad Light Graphics score Rank 212 / 1,247

  1. 34,840
  2. 34,840
  3. 34,840
  4. 34,840
  5. 34,840
  6. 34,840
  7. 34,840

Steel Nomad Graphics score Rank 212 / 1,247

  1. 8,134
  2. 8,134
  3. 8,134
  4. 8,134
  5. 8,134
  6. 8,134
  7. 8,134

Port Royal (Raytracing) Rank 212 / 4,176

  1. 22,063
  2. 22,063
  3. 22,063
  4. 22,063
  5. 22,063
  6. 22,063
  7. 22,063

Speed Way Graphics Score (Raytracing) Rank 212 / 3,536

  1. 8,982
  2. 8,982
  3. 8,982
  4. 8,982
  5. 8,982
  6. 8,982
  7. 8,982

Solar Bay (Raytracing) Rank 212 / 1,247

  1. 151,945
  2. 151,945
  3. 151,945
  4. 151,945
  5. 151,945
  6. 151,945
  7. 151,945

More benchmarks for the graphics card Manli Polar Fox GeForce RTX 5080 OC