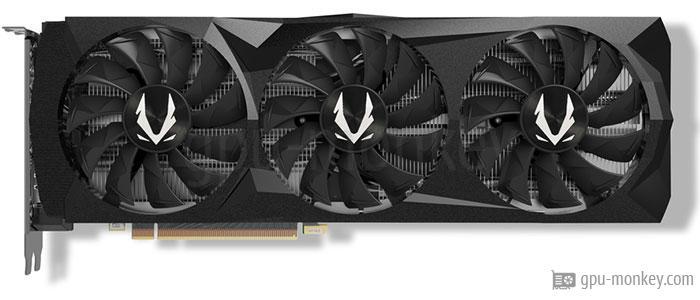
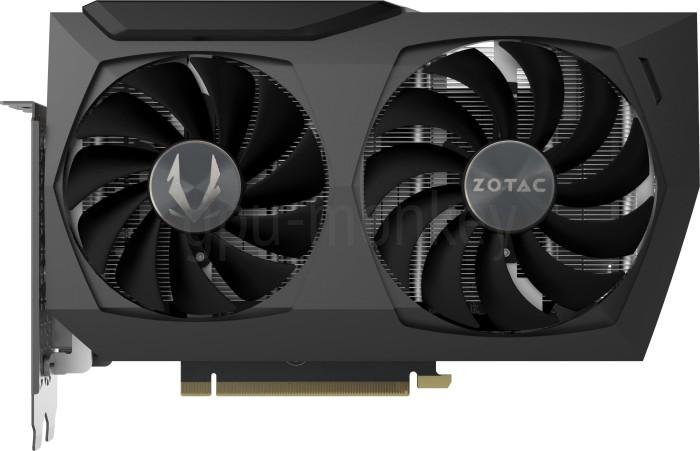
The ZOTAC GAMING GeForce RTX 2080 AMP has 2944 shader units and these clock at a maximum of 1.83 GHz and achieve an FP32 computing power of 10.78 TFLOPS.
Quick comparison
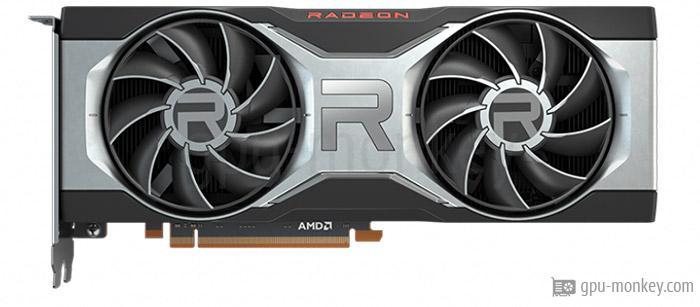
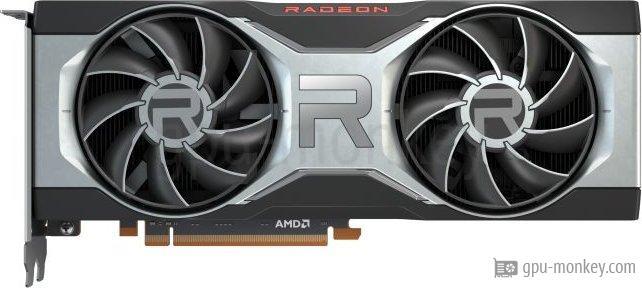
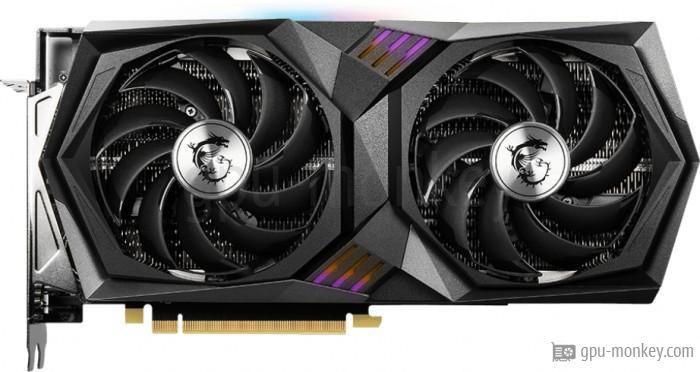
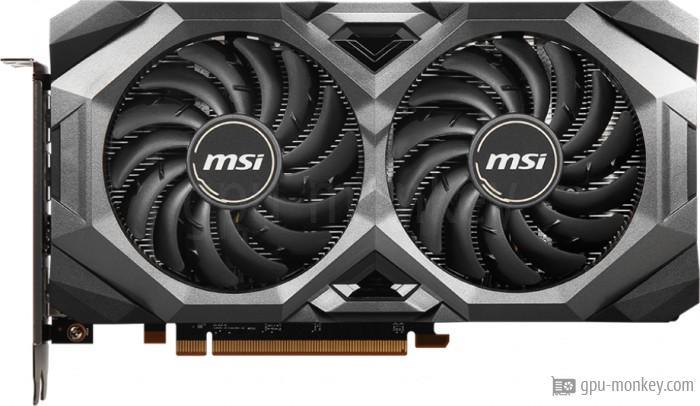
In FP32 performance, the MSI Radeon RX 6700 XT 12G is 23 % faster than the ZOTAC GAMING GeForce RTX 2080 AMP.
The MSI Radeon RX 6700 XT 12G is equipped with a graphics chip of the RDNA 2 architecture, which has 40 streaming multiprocessors.
The graphics card ZOTAC GAMING GeForce RTX 2080 AMP is based on the Turing architecture and is equipped with 46 execution units.
Memory
Memory
MSI Radeon RX 6700 XT 12G
ZOTAC GAMING GeForce RTX 2080 AMP
Memory Size
12 GB
8 GB
Memory Type
GDDR6
GDDR6
Memory Clock
2.000 GHz
1.750 GHz
Memory Speed
16.0 Gbps
14.0 Gbps
Memory bandwidth
384 GB/s
448 GB/s
Memory Interface
192 bit
256 bit
More information
The MSI Radeon RX 6700 XT 12G is equipped with a 12 GB large GDDR6 graphics memory, which is equipped with 2.000 GHz clocks.
The ZOTAC GAMING GeForce RTX 2080 AMP has a 8 GB large GDDR6 graphics memory and the memory clock is 1.750GHz.
Clock Speeds
Clock Speeds
MSI Radeon RX 6700 XT 12G
ZOTAC GAMING GeForce RTX 2080 AMP
Base Clock
2.321 GHz
1.515 GHz
Boost Clock
2.581 GHz
1.830 GHz
Avg (Game) Clock
2.42 GHz
1.71 GHz
Overclocking
Yes
Yes
More information
The MSI Radeon RX 6700 XT 12G has a turbo clock of 2.581 GHz. The turbo frequency of the ZOTAC GAMING GeForce RTX 2080 AMP is 1.830 GHz.
Thermal Design
Thermal Design
MSI Radeon RX 6700 XT 12G
ZOTAC GAMING GeForce RTX 2080 AMP
TDP
230 W
225 W
Tjunction max
100 °C
88 °C
PCIe-Power
1 x 6-Pin, 1 x 8-Pin
1 x 6-Pin, 1 x 8-Pin
More information
The MSI Radeon RX 6700 XT 12G has 1 x 6-Pin, 1 x 8-Pin connectors through which it is supplied with power. The manufacturer specifies the maximum operating temperature of the graphics card as 100 °C.
The ZOTAC GAMING GeForce RTX 2080 AMP is equipped with a 1 x 6-Pin, 1 x 8-Pin PCIe power connector that supplies it with power. The maximum operating temperature of the card is 88 °C.
Cooler & Fans
Cooler & Fans
MSI Radeon RX 6700 XT 12G
ZOTAC GAMING GeForce RTX 2080 AMP
Fan-Type
Axial
Axial
Fan 1
2 x 90 mm
3 x 90 mm
Cooler-Type
Air cooling
Air cooling
Noise (Idle)
0 dB
--
More information
The graphics processor and graphics memory of the MSI Radeon RX 6700 XT 12G are cooled with a Air cooling.
The ZOTAC GAMING GeForce RTX 2080 AMP is cooled by a Air cooling.
Connectivity
Connectivity
MSI Radeon RX 6700 XT 12G
ZOTAC GAMING GeForce RTX 2080 AMP
Max. Displays
4
4
HDCP
2.3
2.2
HDMI
1x HDMI 2.1
1x HDMI 2.0b
DisplayPort
3x DP 1.4a
3x DP 1.4a
USB-C
--
1
More information
The MSI Radeon RX 6700 XT 12G supports the downward compatible copy protection HDCP in version 2.3.
The ZOTAC GAMING GeForce RTX 2080 AMP supports HDCP in version 2.2 and all previous versions.
Featureset
Featureset
MSI Radeon RX 6700 XT 12G
ZOTAC GAMING GeForce RTX 2080 AMP
Max. resolution
7680x4320
7680x4320
DirectX
12_2 (Ultimate)
12_2 (Ultimate)
Raytracing
Yes
Yes
DLSS / FSR
Yes
Yes
LED
Non addressable LED
No LED lighting
More information
The MSI Radeon RX 6700 XT 12G supports the DirectX standard from Microsoft in version 12_2 (Ultimate).
The ZOTAC GAMING GeForce RTX 2080 AMP supports Microsoft's DirectX version 12_2 (Ultimate).
Supported Video Codecs
Supported Video Codecs
MSI Radeon RX 6700 XT 12G
ZOTAC GAMING GeForce RTX 2080 AMP
h264
Decode / Encode
Decode / Encode
h265 / HEVC
Decode / Encode
Decode / Encode
VP8
Decode / Encode
Decode
VP9
Decode / Encode
Decode
AV1
Decode
No
More information
This area lists which video codecs can be decoded or encoded by the graphics cards in hardware. As a result, the power consumption can be reduced due to a lower processor load.
Dimensions
Dimensions
MSI Radeon RX 6700 XT 12G
ZOTAC GAMING GeForce RTX 2080 AMP
Length
267 mm
308 mm
Height
110 mm
113 mm
Width
40 mm
57 mm
Width (Slots)
2 Slots
3 Slots
Weight
908 g
--
SFF-Ready
No
No
More information
The MSI Radeon RX 6700 XT 12G is 40 mm wide and therefore needs the space of 3 PCIe-Slots in the case.
The width of the ZOTAC GAMING GeForce RTX 2080 AMP is 40 mm and thus requires the space of 3 PCIe-Slots in the PC case.
3DMark is a benchmark program that determines the performance of certain components of a computer and then reports the performance as a numerical value.
Cyberpunk 2077 was developed by CD Projekt Red and is based on the development studio's own REDengine 4. Ray tracing is switched off in our benchmarks.
The Last of Us Part One is a game released by Sony in June 2013 exclusively for the Playstation and released for the PC in early 2023. The benchmark values here were determined at high details.
Geekbench 6 is a cross-platform benchmark for main processors, which also carries out 3 different graphics benchmarks and outputs them in the form of a numerical value.
The theoretical computing power of the graphics card with single precision (32 bit) in TFLOPS indicates how many trillion FP32 floating point operations the graphics card (GPU) can perform per second.
Here you can rate the MSI Radeon RX 6700 XT 12G to help other visitors make their purchasing decisions. The average rating is 0 stars (0 ratings). Rate now:
Here you can rate the ZOTAC GAMING GeForce RTX 2080 AMP to help other visitors make their purchasing decisions. The average rating is 0 stars (0 ratings). Rate now: