


Gainward GeForce RTX 4080 SUPER Phoenix
Benchmark and Specs
Last updated:
Benchmark and Specs
Here you will find all technical data as well as various benchmarks of the Gainward GeForce RTX 4080 SUPER Phoenix. Up to 4 screens with a maximum resolution of up to 7680x4320 can be operated with this graphics card. The maximum turbo clock of the Gainward GeForce RTX 4080 SUPER Phoenix is 2.550 GHz, so the graphics card achieves an FP32 computing power of 52.22 TFLOPS.
GPUThe Gainward GeForce RTX 4080 SUPER Phoenix is equipped with 80 execution and 10240 shader units. With single precision, a theoretical FP32 computing power of 52.22 TFLOPS is achieved. |
|
| Based on: | NVIDIA GeForce RTX 4080 SUPER |
| GPU Chip: | AD103-400-A1 (Ada Lovelace) |
| Streaming Multiprocessors: | 80 |
| Shader: | 10240 |
| Render Output Units: | 112 |
| Texture Units: | 320 |
| Raytracing Cores: | 80 |
MemoryThe Gainward GeForce RTX 4080 SUPER Phoenix has a 256 bit wide memory interface, with which a memory bandwidth of 736 GB/s is achieved. In total, 16 GB GDDR6X graphics memory is available for the graphics card. |
|
| Memory Size: | 16 GB |
| Memory Type: | GDDR6X |
| Memory Clock: | 1.438 GHz |
| Memory Speed: | 23.0 Gbps |
| Memory bandwidth: | 736 GB/s |
| Memory Interface: | 256 bit |
Clock SpeedsThe manufacturer specifies the memory clock of the Gainward GeForce RTX 4080 SUPER Phoenix with 2.295 GHz (base clock) or with 2.550 GHz (turbo clock). If overclocking is supported (see below), the clock rate can be increased even further. |
|
| Base Clock: | 2.295 GHz |
| Boost Clock: | 2.550 GHz |
| Avg (Game) Clock: | |
| Overclocking: | Yes |
Thermal DesignThe Gainward GeForce RTX 4080 SUPER Phoenix has 1 x 16-Pin plugs, which supply the graphics card with energy. The maximum operating temperature of the card is 90 °C. |
|
| TDP: | 320 W (Reference) |
| TDP (up): | -- |
| Tjunction max: | 90 °C |
| PCIe-Power: | 1 x 16-Pin |
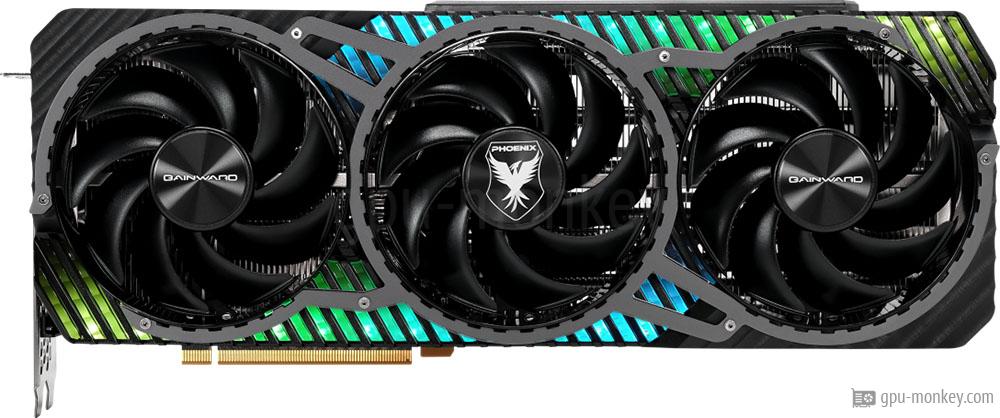
Cooler & FansThe Gainward GeForce RTX 4080 SUPER Phoenix is equipped with 3 Axial main fans, which are used to cool the graphics processor and graphics memory. |
|
| Fan-Type: | Axial |
| Fan 1: | 3 x 100 mm |
| Fan 2: | -- |
| Cooler-Type: | Air cooling |
| Noise (Idle): | 0 dB / Silent |
| Noise (Load): | -- |
ConnectivityUp to 4 screens can be connected to the Gainward GeForce RTX 4080 SUPER Phoenix, whereby the backward-compatible HDCP copy protection is supported in the 2.3 version. |
|
| Max. Displays: | 4 |
| HDCP-Version: | 2.3 |
| HDMI Ports: | 1x HDMI v2.1a |
| DP Ports: | 3x DP v1.4a |
| DVI Ports: | -- |
| VGA Ports: | -- |
| USB-C Ports: | -- |
FeaturesetThe Gainward GeForce RTX 4080 SUPER Phoenix supports a maximum resolution of 7680x4320 pixels and the DirectX standard version 12_2 (Ultimate). |
|
| Max. resolution: | 7680x4320 |
| DirectX: | 12_2 (Ultimate) |
| Raytracing: | Yes |
| DLSS / FSR: | Yes |
| LED: | Addressable LED |
Supported Video CodecsHere is a list of which video codecs can be decoded / encoded by the Gainward GeForce RTX 4080 SUPER Phoenix in hardware in order to minimize the processor load. |
|
| h264: | Decode / Encode |
| h265 / HEVC: | Decode / Encode |
| VP8: | Decode |
| VP9: | Decode |
| AV1: | Decode |
DimensionsThe dimensions of the Gainward GeForce RTX 4080 SUPER Phoenix are 329 mm in length, 131 mm in height and 64 mm in width. Thus 4 PCIe-Slots are needed in a case. |
|
| Length: | 329 mm |
| Height: | 131 mm |
| Width: | 64 mm |
| Width (Slots): | 4 PCIe-Slots |
| Weight: | -- |
| SFF-Ready: | No |
Additional dataThe Gainward GeForce RTX 4080 SUPER Phoenix is manufactured in a structure width of 5 nm and has a PCIe 4.0 x 16 lanes interface. The graphics card was released in Q1/2024. |
|
| GPU Interface: | PCIe 4.0 x 16 |
| Release date: | Q1/2024 |
| Launch Price: | 999 $ (Reference) |
| Structure size: | 5 nm |
| Part-no: | NED408S019T2-1032X |
| Documents: | data sheet |
2.295 GHz, 16 GB (-- TDP)
Buy this graphic card at amazon!

Rate this graphics card
Benchmark results
3DMark Benchmark (DirectX, Raytracing)
3DMark is a benchmark program that determines the performance of certain components of a computer and then reports the performance as a numerical value.
Time Spy Extreme Graphics score

|
Gainward GeForce RTX 4080 SUPER Phoenix
16 GB GDDR6X |
||

|
NVIDIA GeForce RTX 4080 SUPER
Average of gpu group |
||
Steel Nomad Light Graphics score
|
|
Gainward GeForce RTX 4080 SUPER Phoenix
16 GB GDDR6X |
||
|
|
NVIDIA GeForce RTX 4080 SUPER
Average of gpu group |
||
Steel Nomad Graphics score
|
|
Gainward GeForce RTX 4080 SUPER Phoenix
16 GB GDDR6X |
||
|
|
NVIDIA GeForce RTX 4080 SUPER
Average of gpu group |
||
Port Royal (Raytracing)
|
|
Gainward GeForce RTX 4080 SUPER Phoenix
16 GB GDDR6X |
||
|
|
NVIDIA GeForce RTX 4080 SUPER
Average of gpu group |
||
Speed Way Graphics Score (Raytracing)
|
|
Gainward GeForce RTX 4080 SUPER Phoenix
16 GB GDDR6X |
||
|
|
NVIDIA GeForce RTX 4080 SUPER
Average of gpu group |
||
Solar Bay (Raytracing)
|
|
Gainward GeForce RTX 4080 SUPER Phoenix
16 GB GDDR6X |
||
|
|
NVIDIA GeForce RTX 4080 SUPER
Average of gpu group |
||
Cyberpunk 2077
Cyberpunk 2077 was developed by CD Projekt Red and is based on the development studio's own REDengine 4. Ray tracing is switched off in our benchmarks.
3840x2160 (2160p)
|
|
Gainward GeForce RTX 4080 SUPER Phoenix
16 GB GDDR6X |
||
|
|
NVIDIA GeForce RTX 4080 SUPER
Average of gpu group |
||
2560x1440 (1440p)
|
|
Gainward GeForce RTX 4080 SUPER Phoenix
16 GB GDDR6X |
||
|
|
NVIDIA GeForce RTX 4080 SUPER
Average of gpu group |
||
1920x1080 (1080p)
|
|
Gainward GeForce RTX 4080 SUPER Phoenix
16 GB GDDR6X |
||
|
|
NVIDIA GeForce RTX 4080 SUPER
Average of gpu group |
||
The Last of Us Part 1
The Last of Us Part One is a game released by Sony in June 2013 exclusively for the Playstation and released for the PC in early 2023. The benchmark values here were determined at high details.
3840x2160 (2160p)
|
|
Gainward GeForce RTX 4080 SUPER Phoenix
16 GB GDDR6X |
||
|
|
NVIDIA GeForce RTX 4080 SUPER
Average of gpu group |
||
2560x1440 (1440p)
|
|
Gainward GeForce RTX 4080 SUPER Phoenix
16 GB GDDR6X |
||
|
|
NVIDIA GeForce RTX 4080 SUPER
Average of gpu group |
||
1920x1080 (1080p)
|
|
Gainward GeForce RTX 4080 SUPER Phoenix
16 GB GDDR6X |
||
|
|
NVIDIA GeForce RTX 4080 SUPER
Average of gpu group |
||
Battlefield 5
Battlefield 5 is a visually stunning game that is ideal as a graphics card benchmark. We test the game with maximum details on Windows 10.
3840x2160 (2160p)
|
|
Gainward GeForce RTX 4080 SUPER Phoenix
16 GB GDDR6X |
||
|
|
NVIDIA GeForce RTX 4080 SUPER
Average of gpu group |
||
2560x1440 (1440p)
|
|
Gainward GeForce RTX 4080 SUPER Phoenix
16 GB GDDR6X |
||
|
|
NVIDIA GeForce RTX 4080 SUPER
Average of gpu group |
||
1920x1080 (1080p)
|
|
Gainward GeForce RTX 4080 SUPER Phoenix
16 GB GDDR6X |
||
|
|
NVIDIA GeForce RTX 4080 SUPER
Average of gpu group |
||
Geekbench 6 (OpenCL, Vulkan, Metal)
Geekbench 6 is a cross-platform benchmark for main processors, which also carries out 3 different graphics benchmarks and outputs them in the form of a numerical value.
Geekbench 6 - OpenCL
|
|
Gainward GeForce RTX 4080 SUPER Phoenix
16 GB GDDR6X |
||
|
|
NVIDIA GeForce RTX 4080 SUPER
Average of gpu group |
||
Geekbench 6 - Vulkan
|
|
Gainward GeForce RTX 4080 SUPER Phoenix
16 GB GDDR6X |
||
|
|
NVIDIA GeForce RTX 4080 SUPER
Average of gpu group |
||
FP32 Performance (Single-precision TFLOPS)
The theoretical computing power of the graphics card with single precision (32 bit) in TFLOPS indicates how many trillion FP32 floating point operations the graphics card (GPU) can perform per second.
FP32 (TFLOPS)
|
|
Gainward GeForce RTX 4080 SUPER Phoenix
16 GB GDDR6X |
||
More benchmarks
In order to determine the performance of a graphics card, so-called "benchmarks" are carried out. The benchmark software carries out special calculations to determine the performance of a graphics card. We use so-called theoretical or synthetic benchmarks (e.g. 3D Mark) as well as real game benchmarks. To ensure real comparability of the results, we pay attention to the correct execution of the benchmarks as well as the condition of the graphics card and the system.We use the following benchmarks to measure the performance of a graphics card:

3DMark Benchmark
5,702 entries
5,702 entries

Cyberpunk 2077
3,197 entries
3,197 entries

The Last of Us Part 1
2,204 entries
2,204 entries

GTA 5 Benchmark
4,768 entries
4,768 entries

Shadow of the Tomb Raider
5,312 entries
5,312 entries

Battlefield 5
4,640 entries
4,640 entries

Geekbench 6
5,311 entries
5,311 entries

FP32 Performance
6,511 entries
6,511 entries
Popular comparisons


