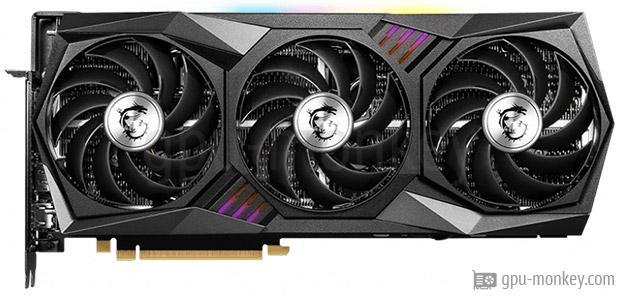
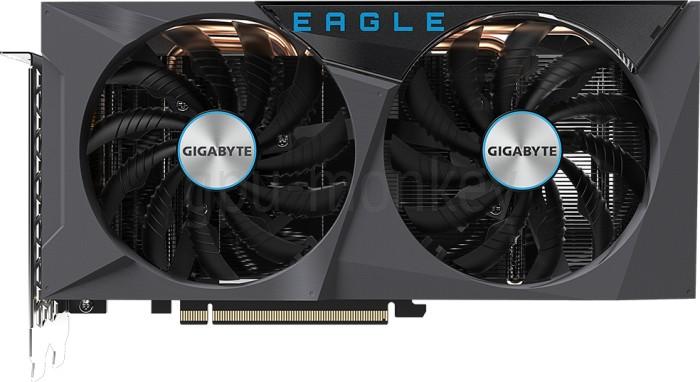
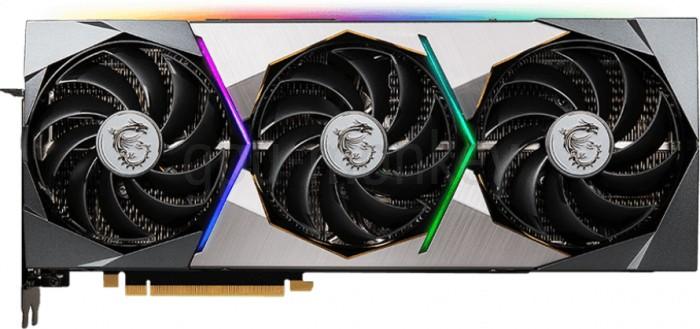
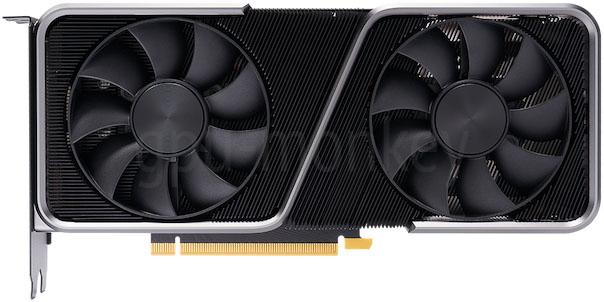
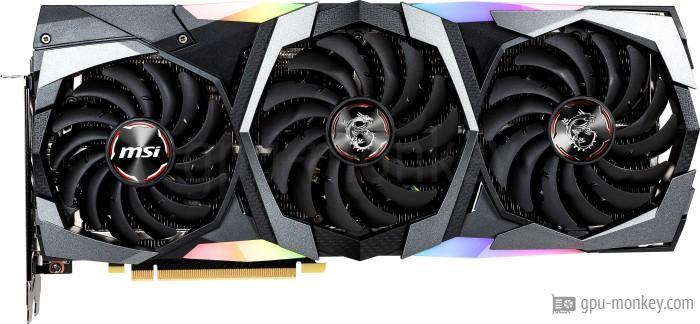
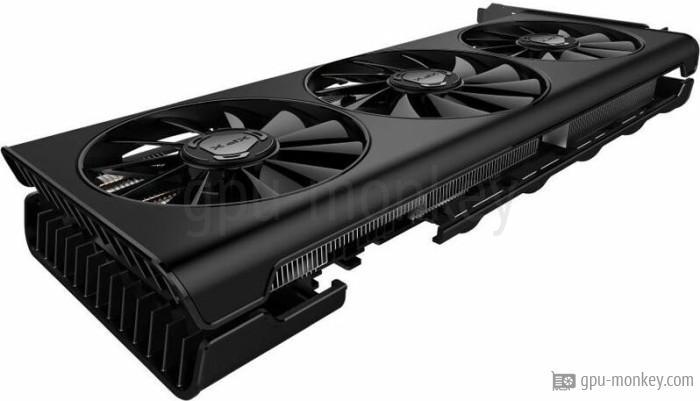
MSI GeForce RTX 2060 SUPER GAMING X
NVIDIA NVIDIA GeForce RTX 2060 SUPER Speed index 6/100 Last updated:

MSI GeForce RTX 2060 SUPER GAMING X Benchmark and Specs

Here you will find all technical data as well as various benchmarks of the MSI GeForce RTX 2060 SUPER GAMING X. Up to 4 screens with a maximum resolution of up to 7680x4320 can be operated with this graphics card. The maximum turbo clock of the MSI GeForce RTX 2060 SUPER GAMING X is 1.695 GHz, so the graphics card achieves an FP32 computing power of 7.38 TFLOPS.
FP32
7.38TFLOPS
Boost Clock
1.70GHz
Memory
8GB GDDR6
TDP
175 W

Technical details

GPU

The MSI GeForce RTX 2060 SUPER GAMING X is equipped with 34 execution and 2176 shader units. With single precision, a theoretical FP32 computing power of 7.38 TFLOPS is achieved.

GPU Chip
TU106 (Turing)
Streaming Multiprocessors
34
Shader
2176
Render Output Units
64
Texture Units
136
Raytracing Cores
34

Memory

The MSI GeForce RTX 2060 SUPER GAMING X has a 256 bit wide memory interface, with which a memory bandwidth of 448 GB/s is achieved. In total, 8 GB GDDR6 graphics memory is available for the graphics card.

Memory Size
8 GB
Memory Type
GDDR6
Memory Clock
1.750 GHz
Memory Speed
14.0 Gbps
Memory bandwidth
448 GB/s
Memory Interface
256 bit

Clock Speeds

The manufacturer specifies the memory clock of the MSI GeForce RTX 2060 SUPER GAMING X with 1.470 GHz (base clock) or with 1.695 GHz (turbo clock). If overclocking is supported (see below), the clock rate can be increased even further.

Base Clock
1.470 GHz
Boost Clock
1.695 GHz+3 %
Overclocking
Yes

Thermal Design

The MSI GeForce RTX 2060 SUPER GAMING X has 1 x 8-Pin plugs, which supply the graphics card with energy. The maximum operating temperature of the card is 89 °C.

TDP
175 W
Tjunction max
89 °C
PCIe-Power
1 x 8-Pin

Cooler & Fans

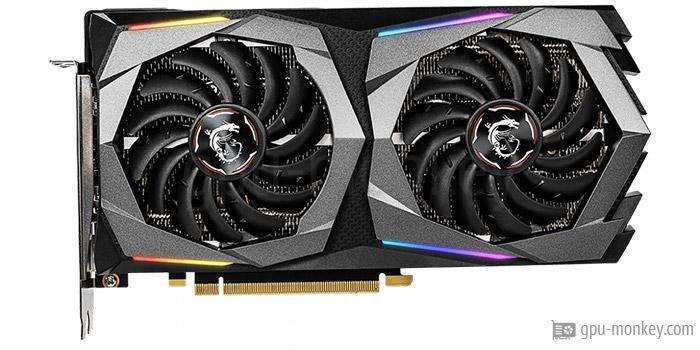
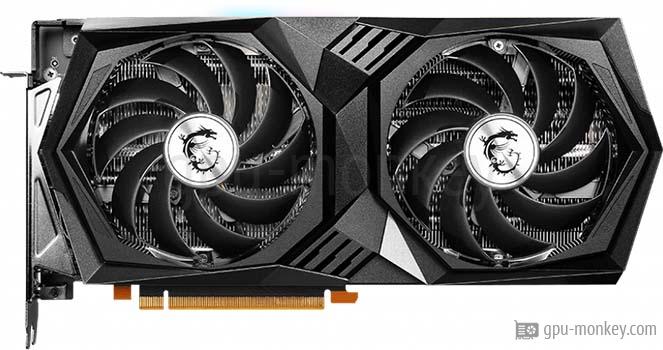
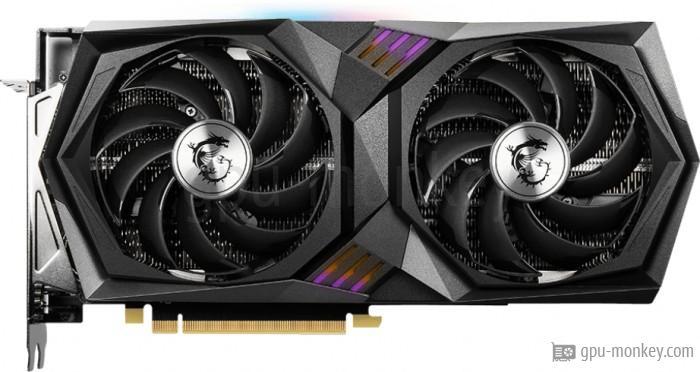
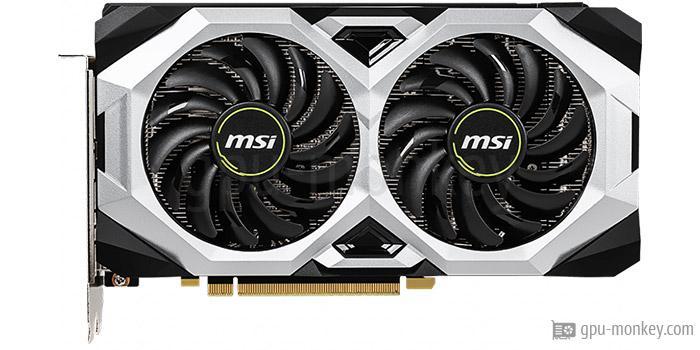
The MSI GeForce RTX 2060 SUPER GAMING X is equipped with 2 Axial main fans, which are used to cool the graphics processor and graphics memory.

Fan-Type
Axial
Fan 1
2 x 90 mm
Cooler-Type
Air cooling
Noise (Idle)
0 dB / Silent

Connectivity

Up to 4 screens can be connected to the MSI GeForce RTX 2060 SUPER GAMING X, whereby the backward-compatible HDCP copy protection is supported in the 2.2 version.

Max. Displays
4
HDCP
2.2
HDMI
1x HDMI 2.0b
DisplayPort
3x DP 1.4a

Featureset

The MSI GeForce RTX 2060 SUPER GAMING X supports a maximum resolution of 7680x4320 pixels and the DirectX standard version 12_2 (Ultimate).

Max. resolution
7680x4320
DirectX
12_2 (Ultimate)
Raytracing
Yes
DLSS / FSR
Yes
LED
No LED lighting

Supported Video Codecs

Here is a list of which video codecs can be decoded / encoded by the MSI GeForce RTX 2060 SUPER GAMING X in hardware in order to minimize the processor load.

h264
Decode / Encode
h265 / HEVC
Decode / Encode
VP8
Decode
VP9
Decode
AV1
No

Dimensions

The dimensions of the MSI GeForce RTX 2060 SUPER GAMING X are 248 mm in length, 128 mm in height and 52 mm in width. Thus 3 PCIe-Slots are needed in a case.

Length
248 mm
Height
128 mm
Width
52 mm
Width (Slots)
3 PCIe-Slots
Weight
981 g
SFF-Ready
No

Additional data

The MSI GeForce RTX 2060 SUPER GAMING X is manufactured in a structure width of 12 nm and has a PCIe 3.0 x 16 lanes interface. The graphics card was released in Q3/2019.

GPU Interface
PCIe 3.0 x 16
Release date
Q3/2019
Launch Price
399 $ (Reference)
Structure size
12 nm
Part-no
V375-214R
Documents
data sheet
MSI GeForce RTX 2060 SUPER GAMING X
1.470 GHz · 8 GB · 175 W TDP
Buy this graphic card at amazon!

Compare with other GPU

Type a model name – the comparison opens automatically.

Rate this graphics card

Here you can rate this graphics card and help other visitors with their purchase decision. The average rating for this graphics card is currently 5.0 stars (1 ratings). Rate it now:

Benchmark results

3DMark Benchmark (DirectX, Raytracing)

3DMark is a benchmark program that determines the performance of certain components of a computer and then reports the performance as a numerical value.

Time Spy Extreme Graphics score Rank 3,188 / 5,633

  1. MSI GeForce RTX 2060 SUPER GAMING XMSI GeForce RTX 2060 SUPER GAMING X8 GB GDDR6
    4,202
  2. NVIDIA GeForce RTX 2060 SUPERNVIDIA GeForce RTX 2060 SUPERAverage of gpu group
    4,281

Port Royal (Raytracing) Rank 2,997 / 4,176

  1. MSI GeForce RTX 2060 SUPER GAMING XMSI GeForce RTX 2060 SUPER GAMING X8 GB GDDR6
    5,148
  2. NVIDIA GeForce RTX 2060 SUPERNVIDIA GeForce RTX 2060 SUPERAverage of gpu group
    5,245

Speed Way Graphics Score (Raytracing) Rank 3,096 / 3,536

  1. MSI GeForce RTX 2060 SUPER GAMING XMSI GeForce RTX 2060 SUPER GAMING X8 GB GDDR6
    1,832
  2. NVIDIA GeForce RTX 2060 SUPERNVIDIA GeForce RTX 2060 SUPERAverage of gpu group
    1,867

Cyberpunk 2077

Cyberpunk 2077 was developed by CD Projekt Red and is based on the development studio's own REDengine 4. Ray tracing is switched off in our benchmarks.

3840x2160 (2160p) Rank 2,606 / 3,187

  1. MSI GeForce RTX 2060 SUPER GAMING XMSI GeForce RTX 2060 SUPER GAMING X8 GB GDDR6
    29 fps (avg)
  2. NVIDIA GeForce RTX 2060 SUPERNVIDIA GeForce RTX 2060 SUPERAverage of gpu group
    29 fps (avg)

2560x1440 (1440p) Rank 2,777 / 3,190

  1. MSI GeForce RTX 2060 SUPER GAMING XMSI GeForce RTX 2060 SUPER GAMING X8 GB GDDR6
    35 fps (avg)
  2. NVIDIA GeForce RTX 2060 SUPERNVIDIA GeForce RTX 2060 SUPERAverage of gpu group
    36 fps (avg)

1920x1080 (1080p) Rank 2,801 / 3,222

  1. MSI GeForce RTX 2060 SUPER GAMING XMSI GeForce RTX 2060 SUPER GAMING X8 GB GDDR6
    53 fps (avg)
  2. NVIDIA GeForce RTX 2060 SUPERNVIDIA GeForce RTX 2060 SUPERAverage of gpu group
    53 fps (avg)

The Last of Us Part 1

The Last of Us Part One is a game released by Sony in June 2013 exclusively for the Playstation and released for the PC in early 2023. The benchmark values here were determined at high details.

2560x1440 (1440p) Rank 2,227 / 2,709

  1. MSI GeForce RTX 2060 SUPER GAMING XMSI GeForce RTX 2060 SUPER GAMING X8 GB GDDR6
    31 fps (avg)
  2. NVIDIA GeForce RTX 2060 SUPERNVIDIA GeForce RTX 2060 SUPERAverage of gpu group
    30 fps (avg)

1920x1080 (1080p) Rank 2,212 / 2,843

  1. MSI GeForce RTX 2060 SUPER GAMING XMSI GeForce RTX 2060 SUPER GAMING X8 GB GDDR6
    64 fps (avg)
  2. NVIDIA GeForce RTX 2060 SUPERNVIDIA GeForce RTX 2060 SUPERAverage of gpu group
    62 fps (avg)

Battlefield 5

Battlefield 5 is a visually stunning game that is ideal as a graphics card benchmark. We test the game with maximum details on Windows 10.

3840x2160 (2160p) Rank 2,746 / 4,595

  1. MSI GeForce RTX 2060 SUPER GAMING XMSI GeForce RTX 2060 SUPER GAMING X8 GB GDDR6
    51 fps (avg)
  2. NVIDIA GeForce RTX 2060 SUPERNVIDIA GeForce RTX 2060 SUPERAverage of gpu group
    48 fps (avg)

2560x1440 (1440p) Rank 2,634 / 4,594

  1. MSI GeForce RTX 2060 SUPER GAMING XMSI GeForce RTX 2060 SUPER GAMING X8 GB GDDR6
    97 fps (avg)
  2. NVIDIA GeForce RTX 2060 SUPERNVIDIA GeForce RTX 2060 SUPERAverage of gpu group
    94 fps (avg)

1920x1080 (1080p) Rank 2,669 / 4,601

  1. MSI GeForce RTX 2060 SUPER GAMING XMSI GeForce RTX 2060 SUPER GAMING X8 GB GDDR6
    134 fps (avg)
  2. NVIDIA GeForce RTX 2060 SUPERNVIDIA GeForce RTX 2060 SUPERAverage of gpu group
    122 fps (avg)

Geekbench 6 (OpenCL, Vulkan, Metal)

Geekbench 6 is a cross-platform benchmark for main processors, which also carries out 3 different graphics benchmarks and outputs them in the form of a numerical value.

Geekbench 6 - OpenCL Rank 2,582 / 5,255

  1. MSI GeForce RTX 2060 SUPER GAMING XMSI GeForce RTX 2060 SUPER GAMING X8 GB GDDR6
    91,165
  2. NVIDIA GeForce RTX 2060 SUPERNVIDIA GeForce RTX 2060 SUPERAverage of gpu group
    86,856

Geekbench 6 - Vulkan Rank 2,804 / 5,233

  1. MSI GeForce RTX 2060 SUPER GAMING XMSI GeForce RTX 2060 SUPER GAMING X8 GB GDDR6
    86,464
  2. NVIDIA GeForce RTX 2060 SUPERNVIDIA GeForce RTX 2060 SUPERAverage of gpu group
    76,272

MonkeyBench 2026.3 · browser GPU test

Average of 2 public MonkeyBench results (WebGPU) for the NVIDIA GeForce RTX 2060 SUPER.

267GPU points (Ø)
Rank 43 / 168 · in the MonkeyBench GPU ranking

More benchmarks

More benchmarks for the graphics card MSI GeForce RTX 2060 SUPER GAMING X

Popular comparisons