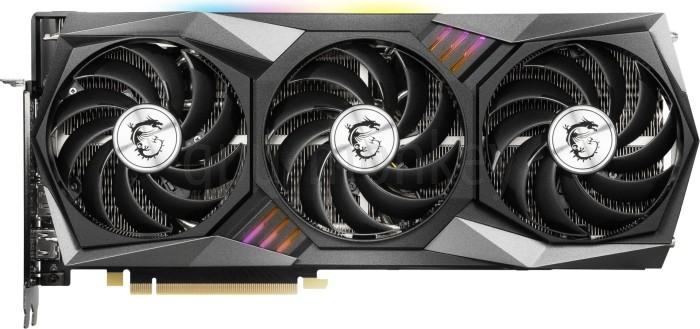
MSI GeForce RTX 3060 Ti Gaming Trio 8G
NVIDIA NVIDIA GeForce RTX 3060 Ti Speed index 14/100 Last updated:

MSI GeForce RTX 3060 Ti Gaming Trio 8G Benchmark and Specs

Here we show you benchmarks and technical data for the MSI GeForce RTX 3060 Ti Gaming Trio 8G. The graphics card is based on the NVIDIA GeForce RTX 3060 Ti (Ampere) and has 8 GB GDDR6 graphics memory with a memory bandwidth of 448 GB/s. The MSI GeForce RTX 3060 Ti Gaming Trio 8G has 38 execution units with 4864 shaders.
FP32
17.08TFLOPS
Boost Clock
1.76GHz
Memory
8GB GDDR6
TDP
240 W

Technical details

GPU

The MSI GeForce RTX 3060 Ti Gaming Trio 8G has 4864 shaders and 38 execution units. The graphics card thus achieves a theoretical FP32 computing power of 17.08 TFLOPS.

GPU Chip
GA104-200-A1 (Ampere)
Streaming Multiprocessors
38
Shader
4864
Render Output Units
80
Texture Units
152
Raytracing Cores
38

Memory

The MSI GeForce RTX 3060 Ti Gaming Trio 8G can use 8 GB graphics memory of the type GDDR6. The graphics card thus achieves a memory bandwidth of 448 GB/s on a 256 bit wide memory interface.

Memory Size
8 GB
Memory Type
GDDR6
Memory Clock
1.750 GHz
Memory Speed
14.0 Gbps
Memory bandwidth
448 GB/s
Memory Interface
256 bit

Clock Speeds

The base clock frequency of the MSI GeForce RTX 3060 Ti Gaming Trio 8G is 1.410 GHz. A high clock frequency (even in turbo mode) can greatly increase the speed of a graphics card.

Base Clock
1.410 GHz
Boost Clock
1.755 GHz+5 %
Avg (Game) Clock
1.665 GHz
Overclocking
Yes

Thermal Design

The TDP (Thermal Design Power) of the MSI GeForce RTX 3060 Ti Gaming Trio 8G is 240 W. The graphics card is supplied with energy via the 2 x 8-Pin connector.

TDP
240 W+20 %
TDP (up)
250 W+14 %
Tjunction max
93 °C
PCIe-Power
2 x 8-Pin

Cooler & Fans

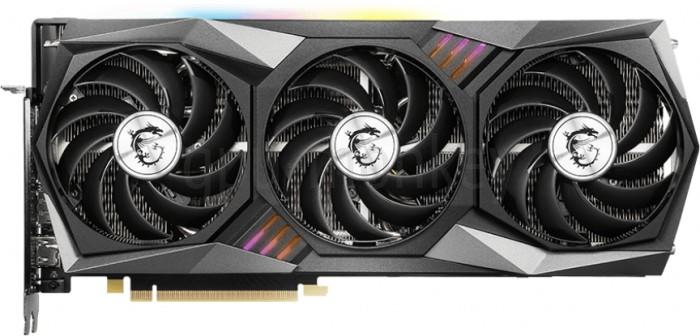
The MSI GeForce RTX 3060 Ti Gaming Trio 8G has a total of 3 Axial fans to cool the graphics processor and graphics memory.

Fan-Type
Axial
Fan 1
3 x 95 mm
Cooler-Type
Air cooling
Noise (Idle)
0 dB / Silent
Noise (Load)
32 dB

Connectivity

Up to 4 screens can be connected to the MSI GeForce RTX 3060 Ti Gaming Trio 8G.

Max. Displays
4
HDCP
2.3
HDMI
1x HDMI 2.1
DisplayPort
3x DP 1.4a

Featureset

The MSI GeForce RTX 3060 Ti Gaming Trio 8G has a maximum resolution of 7680x4320 pixels. The graphics card supports the DirectX 12_2 (Ultimate) standard.

Max. resolution
7680x4320
DirectX
12_2 (Ultimate)
Raytracing
Yes
DLSS / FSR
Yes
LED
MSI Mystic Light

Supported Video Codecs

The video codecs accelerated in hardware by the MSI GeForce RTX 3060 Ti Gaming Trio 8G reduce the processor load and ensure lower energy consumption.

h264
Decode / Encode
h265 / HEVC
Decode / Encode
VP8
Decode
VP9
Decode
AV1
Decode

Dimensions

The MSI GeForce RTX 3060 Ti Gaming Trio 8G is 323 mm long and 140 mm high. With a width of 56 mm, the graphics card requires 3 PCIe-Slots in the case.

Length
323 mm
Height
140 mm
Width
56 mm
Width (Slots)
3 PCIe-Slots
Weight
1452 g
SFF-Ready
No

Additional data

The MSI GeForce RTX 3060 Ti Gaming Trio 8G made in 8 nm was published in Q4/2020 for 479 $.

GPU Interface
PCIe 4.0 x 16
Release date
Q4/2020
Launch Price
479 $
Structure size
8 nm
Documents
data sheet
MSI GeForce RTX 3060 Ti Gaming Trio 8G
1.410 GHz · 8 GB · 240 W TDP
Buy this graphic card at amazon!

Compare with other GPU

Type a model name – the comparison opens automatically.

Rate this graphics card

Here you can rate this graphics card and help other visitors with their purchase decision. The average rating for this graphics card is currently 0 stars (0 ratings). Rate it now:

Benchmark results

3DMark Benchmark (DirectX, Raytracing)

3DMark is a benchmark program that determines the performance of certain components of a computer and then reports the performance as a numerical value.

Time Spy Extreme Graphics score Rank 2,267 / 5,633

  1. MSI GeForce RTX 3060 Ti Gaming Trio 8GMSI GeForce RTX 3060 Ti Gaming Trio 8G8 GB GDDR6
    5,714
  2. NVIDIA GeForce RTX 3060 TiNVIDIA GeForce RTX 3060 TiAverage of gpu group
    5,719

Port Royal (Raytracing) Rank 2,225 / 4,176

  1. MSI GeForce RTX 3060 Ti Gaming Trio 8GMSI GeForce RTX 3060 Ti Gaming Trio 8G8 GB GDDR6
    6,994
  2. NVIDIA GeForce RTX 3060 TiNVIDIA GeForce RTX 3060 TiAverage of gpu group
    7,000

Speed Way Graphics Score (Raytracing) Rank 2,174 / 3,536

  1. MSI GeForce RTX 3060 Ti Gaming Trio 8GMSI GeForce RTX 3060 Ti Gaming Trio 8G8 GB GDDR6
    2,986
  2. NVIDIA GeForce RTX 3060 TiNVIDIA GeForce RTX 3060 TiAverage of gpu group
    2,988

Cyberpunk 2077

Cyberpunk 2077 was developed by CD Projekt Red and is based on the development studio's own REDengine 4. Ray tracing is switched off in our benchmarks.

3840x2160 (2160p) Rank 1,850 / 3,187

  1. MSI GeForce RTX 3060 Ti Gaming Trio 8GMSI GeForce RTX 3060 Ti Gaming Trio 8G8 GB GDDR6
    42 fps (avg)
  2. NVIDIA GeForce RTX 3060 TiNVIDIA GeForce RTX 3060 TiAverage of gpu group
    41 fps (avg)

2560x1440 (1440p) Rank 1,982 / 3,190

  1. MSI GeForce RTX 3060 Ti Gaming Trio 8GMSI GeForce RTX 3060 Ti Gaming Trio 8G8 GB GDDR6
    50 fps (avg)
  2. NVIDIA GeForce RTX 3060 TiNVIDIA GeForce RTX 3060 TiAverage of gpu group
    48 fps (avg)

1920x1080 (1080p) Rank 1,892 / 3,222

  1. MSI GeForce RTX 3060 Ti Gaming Trio 8GMSI GeForce RTX 3060 Ti Gaming Trio 8G8 GB GDDR6
    75 fps (avg)
  2. NVIDIA GeForce RTX 3060 TiNVIDIA GeForce RTX 3060 TiAverage of gpu group
    72 fps (avg)

The Last of Us Part 1

The Last of Us Part One is a game released by Sony in June 2013 exclusively for the Playstation and released for the PC in early 2023. The benchmark values here were determined at high details.

3840x2160 (2160p) Rank 1,769 / 2,190

  1. MSI GeForce RTX 3060 Ti Gaming Trio 8GMSI GeForce RTX 3060 Ti Gaming Trio 8G8 GB GDDR6
    19 fps (avg)
  2. NVIDIA GeForce RTX 3060 TiNVIDIA GeForce RTX 3060 TiAverage of gpu group
    18 fps (avg)

2560x1440 (1440p) Rank 1,742 / 2,709

  1. MSI GeForce RTX 3060 Ti Gaming Trio 8GMSI GeForce RTX 3060 Ti Gaming Trio 8G8 GB GDDR6
    42 fps (avg)
  2. NVIDIA GeForce RTX 3060 TiNVIDIA GeForce RTX 3060 TiAverage of gpu group
    40 fps (avg)

1920x1080 (1080p) Rank 1,699 / 2,843

  1. MSI GeForce RTX 3060 Ti Gaming Trio 8GMSI GeForce RTX 3060 Ti Gaming Trio 8G8 GB GDDR6
    93 fps (avg)
  2. NVIDIA GeForce RTX 3060 TiNVIDIA GeForce RTX 3060 TiAverage of gpu group
    88 fps (avg)

Battlefield 5

Battlefield 5 is a visually stunning game that is ideal as a graphics card benchmark. We test the game with maximum details on Windows 10.

3840x2160 (2160p) Rank 1,736 / 4,595

  1. MSI GeForce RTX 3060 Ti Gaming Trio 8GMSI GeForce RTX 3060 Ti Gaming Trio 8G8 GB GDDR6
    72 fps (avg)
  2. NVIDIA GeForce RTX 3060 TiNVIDIA GeForce RTX 3060 TiAverage of gpu group
    68 fps (avg)

2560x1440 (1440p) Rank 1,770 / 4,594

  1. MSI GeForce RTX 3060 Ti Gaming Trio 8GMSI GeForce RTX 3060 Ti Gaming Trio 8G8 GB GDDR6
    127 fps (avg)
  2. NVIDIA GeForce RTX 3060 TiNVIDIA GeForce RTX 3060 TiAverage of gpu group
    122 fps (avg)

1920x1080 (1080p) Rank 1,762 / 4,601

  1. MSI GeForce RTX 3060 Ti Gaming Trio 8GMSI GeForce RTX 3060 Ti Gaming Trio 8G8 GB GDDR6
    175 fps (avg)
  2. NVIDIA GeForce RTX 3060 TiNVIDIA GeForce RTX 3060 TiAverage of gpu group
    166 fps (avg)

Geekbench 6 (OpenCL, Vulkan, Metal)

Geekbench 6 is a cross-platform benchmark for main processors, which also carries out 3 different graphics benchmarks and outputs them in the form of a numerical value.

Geekbench 6 - OpenCL Rank 1,928 / 5,255

  1. MSI GeForce RTX 3060 Ti Gaming Trio 8GMSI GeForce RTX 3060 Ti Gaming Trio 8G8 GB GDDR6
    115,010
  2. NVIDIA GeForce RTX 3060 TiNVIDIA GeForce RTX 3060 TiAverage of gpu group
    111,935

Geekbench 6 - Vulkan Rank 1,956 / 5,233

  1. MSI GeForce RTX 3060 Ti Gaming Trio 8GMSI GeForce RTX 3060 Ti Gaming Trio 8G8 GB GDDR6
    109,087
  2. NVIDIA GeForce RTX 3060 TiNVIDIA GeForce RTX 3060 TiAverage of gpu group
    87,012

MonkeyBench 2026.3 · browser GPU test

Average of 59 public MonkeyBench results (WebGPU) for the NVIDIA GeForce RTX 3060 Ti.

347GPU points (Ø)
Rank 64 / 446 · in the MonkeyBench GPU ranking

More benchmarks

More benchmarks for the graphics card MSI GeForce RTX 3060 Ti Gaming Trio 8G

Popular comparisons