


3DMark Benchmark (DirectX, Raytracing)
3DMark is a benchmark program that determines the performance of certain components of a computer and then reports the performance as a numerical value.
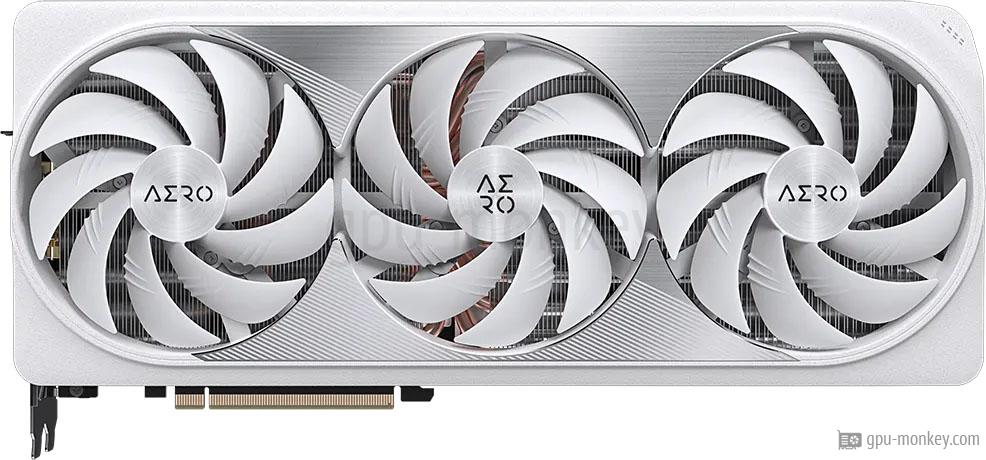
Here you can see how fast the GIGABYTE GeForce RTX 4080 16GB AERO OC is in 3DMark Benchmark (DirectX, Raytracing). The performance of the graphics card in benchmarks or games primarily depends on the GPU architecture, the number of texture shaders and the memory size. The GIGABYTE GeForce RTX 4080 16GB AERO OC has 16 GB GDDR6X memory.
3DMark is a benchmark program that determines the performance of certain components of a computer and then reports the performance as a numerical value.


 Cyberpunk 2077GIGABYTE GeForce RTX 4080 16GB AERO OC
 The Last of Us Part 1GIGABYTE GeForce RTX 4080 16GB AERO OC
 GTA 5 BenchmarkGIGABYTE GeForce RTX 4080 16GB AERO OC
 Shadow of the Tomb RaiderGIGABYTE GeForce RTX 4080 16GB AERO OC
 Battlefield 5GIGABYTE GeForce RTX 4080 16GB AERO OC
 Geekbench 6GIGABYTE GeForce RTX 4080 16GB AERO OC
 Crypto-Mining Ethereum HashrateGIGABYTE GeForce RTX 4080 16GB AERO OC
 Crypto-Mining Ergo HashrateGIGABYTE GeForce RTX 4080 16GB AERO OC
 Crypto-Mining Ravencoin HashrateGIGABYTE GeForce RTX 4080 16GB AERO OC
 Crypto-Mining Vertcoin HashrateGIGABYTE GeForce RTX 4080 16GB AERO OC
 FP32 PerformanceGIGABYTE GeForce RTX 4080 16GB AERO OC


