All technical data and various benchmarks of the NVIDIA GeForce GT 730 are listed on this page. The graphics card is based on the GK208-302-B1 (Kepler 2.0) graphics chip, which is manufactured with a structure width of 28 nm. The NVIDIA GeForce GT 730 can operate up to 3 screens with a maximum resolution of up to 3840x2160 become.
GPU
The NVIDIA GeForce GT 730 has 2 execution units with 384 shaders. This gives the graphics card a theoretical FP32 computing power of 0.69 TFLOPS.
The NVIDIA GeForce GT 730 is equipped with 1 GB graphics memory of the type GDDR5. The memory clock of the graphics card is 1.253 GHz and the speed is 5.01 Gbps.
Memory Size:
1 GB
Memory Type:
GDDR5
Memory Clock:
1.253 GHz
Memory Speed:
5.0 Gbps
Memory bandwidth:
40 GB/s
Memory Interface:
64 bit
Clock Speeds
The base frequency of this graphics card is 0.902 GHz and the manufacturer specifies the maximum turbo clock as 0.902 GHz. If supported (see below), the performance can be further increased by overclocking.
Base Clock:
0.902 GHz
Boost Clock:
0.902 GHz
Avg (Game) Clock:
Overclocking:
No
Thermal Design
The NVIDIA GeForce GT 730 is powered by connectors. The TDP (Thermal Design Power) of the graphics card is 38 W.
TDP:
38 W
TDP (up):
--
Tjunction max:
Unknown
PCIe-Power:
Cooler & Fans
Graphics processor and graphics memory of the NVIDIA GeForce GT 730 are cooled by a Air cooling.
Fan-Type:
--
Fan 1:
--
Fan 2:
--
Cooler-Type:
Air cooling
Noise (Idle):
--
Noise (Load):
--
Connectivity
Up to 3 monitors can be operated with the NVIDIA GeForce GT 730.
Max. Displays:
3
HDCP-Version:
2.2
HDMI Ports:
1x HDMI v1.4a
DP Ports:
--
DVI Ports:
1
VGA Ports:
1
USB-C Ports:
--
Featureset
With the NVIDIA GeForce GT 730 it is possible to operate a screen with a resolution of up to 3840x2160 pixels. Furthermore, the DirectX standard version 12 (11_1) is supported.
Max. resolution:
3840x2160
DirectX:
12 (11_1)
Raytracing:
No
DLSS / FSR:
No
LED:
No LED lighting
Supported Video Codecs
This area lists the video codecs that the NVIDIA GeForce GT 730 can decode or encode in hardware in order to minimize the processor load, which leads to lower power consumption.
h264:
Decode
h265 / HEVC:
No
VP8:
No
VP9:
No
AV1:
No
Dimensions
The NVIDIA GeForce GT 730 needs the space of 1 PCIe-Slots in a case. It is -- long, -- high and -- wide.
Length:
--
Height:
--
Width:
--
Width (Slots):
1 PCIe-Slots
Weight:
--
SFF-Ready:
No
Additional data
The NVIDIA GeForce GT 730 was released in Q2/2014 at a price of 59 $ (Reference). The graphics card manufactured in 28 nm is connected to the system via PCIe 2.0 x 8 lanes.
GPU Interface:
PCIe 2.0 x 8
Release date:
Q2/2014
Launch Price:
59 $ (Reference)
Structure size:
28 nm
Part-no:
--
Documents:
--
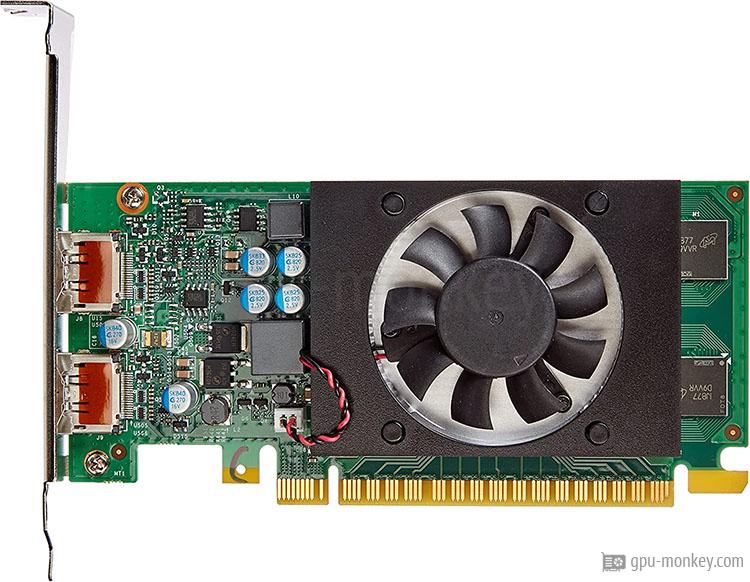
NVIDIA GeForce GT 730 0.902 GHz, 1 GB (38 W TDP)
Buy this graphic card at amazon!
Rate this graphics card
Here you can rate this graphics card and help other visitors with their purchase decision. The average rating for this graphics card is currently 2.6 stars (19 ratings). Rate it now:
The theoretical computing power of the graphics card with single precision (32 bit) in TFLOPS indicates how many trillion FP32 floating point operations the graphics card (GPU) can perform per second.
In order to determine the performance of a graphics card, so-called "benchmarks" are carried out. The benchmark software carries out special calculations to determine the performance of a graphics card. We use so-called theoretical or synthetic benchmarks (e.g. 3D Mark) as well as real game benchmarks. To ensure real comparability of the results, we pay attention to the correct execution of the benchmarks as well as the condition of the graphics card and the system.
We use the following benchmarks to measure the performance of a graphics card: