









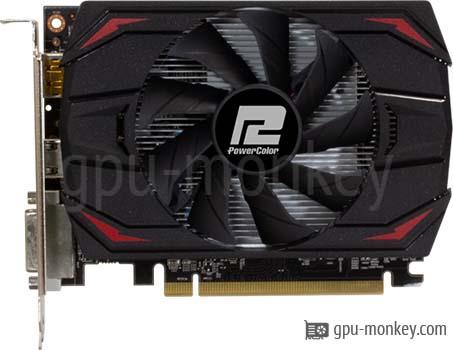
AMD Radeon RX 550 (Baffin 10 CU)
AMD 12 models Q2/2017

AMD Radeon RX 550 (Baffin 10 CU) GPU list 2026

We list 12 graphics cards based on the AMD Radeon RX 550 (Baffin 10 CU) (Baffin LE) with 2 GB GDDR5 – with benchmarks, clock speeds and technical data of all board partner models.

FP32
1.37TFLOPS
Boost Clock
1.07GHz
Memory
2GB GDDR5
TDP
60W

GPUs based on AMD Radeon RX 550 (Baffin 10 CU)

All board partner models sorted by FP32 performance. The percentage shows the deviation of the boost clock from the reference design.

GPUFP32Boost ClockMemoryTDP
1.52TFLOPS 1.19GHz+11 % 2GB 60W
1.52TFLOPS 1.19GHz+11 % 4GB 60W
1.38TFLOPS 1.08GHz+1 % 2GB 60W
1.37TFLOPS 1.07GHz 2GB 60W
1.37TFLOPS 1.07GHz 4GB 60W
1.37TFLOPS 1.07GHz 2GB 60W
1.37TFLOPS 1.07GHz 4GB 60W
1.37TFLOPS 1.07GHz 2GB 65W
1.37TFLOPS 1.07GHz 4GB 65W

Technical details

GPU

GPU Chip
Baffin LE (GCN 4)
Streaming Multiprocessors
10
Shader
640
Render Output Units
16
Texture Units
40
FP32
1.37 TFLOPS

Memory

Memory Size
2 GB
Memory Type
GDDR5
Memory Clock
1,500.000 GHz
Memory Speed
6.0 Gbps
Memory bandwidth
96 GB/s
Memory Interface
128 bit

Clock Speeds

Base Clock
1.019 GHz
Boost Clock
1.071 GHz

Thermal Design

TDP
60 W
Tjunction max
80 °C
GPU Interface
PCIe 3.0 x 8

Featureset

Max. Displays
4
Max. resolution
5120x2880
DirectX
12
Raytracing
No
DLSS / FSR
Yes
Structure size
14 nm

Supported Video Codecs

h264
Decode / Encode
h265 / HEVC
Decode / Encode
VP8
Decode
VP9
Decode
AV1
No
Launch Price
79 $

Benchmark results

Average of gpu group

3DMark Benchmark (DirectX, Raytracing)

3DMark is a benchmark program that determines the performance of certain components of a computer and then reports the performance as a numerical value.

Battlefield 5

Battlefield 5 is a visually stunning game that is ideal as a graphics card benchmark. We test the game with maximum details on Windows 10.

3840x2160 (2160p)

  1. 14 fps (avg)
  2. 12 fps (avg)
  3. 11 fps (avg)
  4. 9 fps (avg)
  5. 8 fps (avg)
  6. 7 fps (avg)
  7. 1 fps (avg)

2560x1440 (1440p)

  1. 32 fps (avg)
  2. 30 fps (avg)
  3. 29 fps (avg)
  4. 18 fps (avg)
  5. 17 fps (avg)
  6. 17 fps (avg)
  7. 16 fps (avg)

1920x1080 (1080p)

  1. 40 fps (avg)
  2. 38 fps (avg)
  3. 36 fps (avg)
  4. 25 fps (avg)
  5. 23 fps (avg)
  6. 22 fps (avg)
  7. 22 fps (avg)

Geekbench 6 (OpenCL, Vulkan, Metal)

Geekbench 6 is a cross-platform benchmark for main processors, which also carries out 3 different graphics benchmarks and outputs them in the form of a numerical value.

Geekbench 6 - OpenCL

  1. 16,747
  2. 14,311
  3. 13,361
  4. 12,367

Geekbench 6 - Vulkan

  1. 15,389
  2. 13,279
  3. 12,346
  4. 11,496

Geekbench 6 - Metal

  1. 17,394
  2. 17,234
  3. 16,644
  4. 15,894