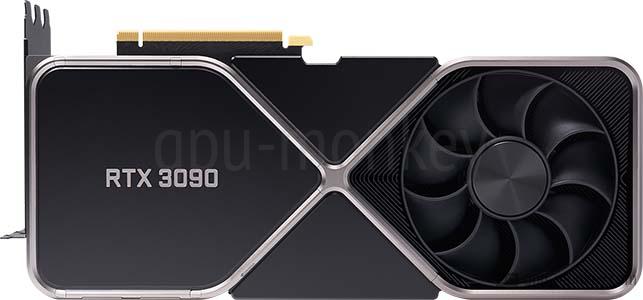
|
40.93TFLOPS |
1.95GHz+15 % |
24GB |
350W |
  |
|
40.30TFLOPS |
1.92GHz+13 % |
24GB |
420W |
|
|
40.30TFLOPS |
1.92GHz+13 % |
24GB |
420W |
|
|
39.67TFLOPS |
1.89GHz+12 % |
24GB |
390W |
|
|
39.67TFLOPS |
1.89GHz+12 % |
24GB |
390W |
|
|
39.67TFLOPS |
1.89GHz+12 % |
24GB |
390W |
|
|
39.67TFLOPS |
1.89GHz+12 % |
24GB |
390W |
|
|
39.36TFLOPS |
1.88GHz+11 % |
24GB |
420W |
|
|
39.36TFLOPS |
1.88GHz+11 % |
24GB |
420W |
|
|
39.36TFLOPS |
1.88GHz+11 % |
24GB |
420W |
|
|
39.04TFLOPS |
1.86GHz+10 % |
24GB |
420W |
|
|
39.04TFLOPS |
1.86GHz+10 % |
24GB |
400W |
|
|
38.73TFLOPS |
1.85GHz+9 % |
24GB |
420W |
|
|
38.73TFLOPS |
1.85GHz+9 % |
24GB |
420W |
|
|
38.73TFLOPS |
1.85GHz+9 % |
24GB |
420W |
|
|
38.10TFLOPS |
1.82GHz+7 % |
24GB |
420W |
|
|
38.10TFLOPS |
1.82GHz+7 % |
24GB |
420W |
|
|
38.10TFLOPS |
1.82GHz+7 % |
24GB |
420W |
|
|
38.10TFLOPS |
1.82GHz+7 % |
24GB |
420W |
|
|
38.10TFLOPS |
1.82GHz+7 % |
24GB |
420W |
|
|
38.10TFLOPS |
1.82GHz+7 % |
24GB |
420W |
|
|
37.78TFLOPS |
1.80GHz+6 % |
24GB |
420W |
|
|
37.78TFLOPS |
1.80GHz+6 % |
24GB |
420W |
|
|
37.78TFLOPS |
1.80GHz+6 % |
24GB |
420W |
|
|
37.47TFLOPS |
1.79GHz+5 % |
24GB |
390W |
|
|
37.47TFLOPS |
1.79GHz+5 % |
24GB |
350W |
|
|
37.47TFLOPS |
1.79GHz+5 % |
24GB |
350W |
|
|
37.47TFLOPS |
1.79GHz+5 % |
24GB |
400W |
|
|
37.47TFLOPS |
1.79GHz+5 % |
24GB |
400W |
|
|
37.47TFLOPS |
1.79GHz+5 % |
24GB |
370W |
|
|
37.15TFLOPS |
1.77GHz+4 % |
24GB |
350W |
|
|
36.84TFLOPS |
1.76GHz+4 % |
24GB |
370W |
|
|
36.84TFLOPS |
1.76GHz+4 % |
24GB |
370W |
|
|
36.84TFLOPS |
1.76GHz+4 % |
24GB |
420W |
|
|
36.84TFLOPS |
1.76GHz+4 % |
24GB |
420W |
|
|
36.84TFLOPS |
1.76GHz+4 % |
24GB |
420W |
|
|
36.84TFLOPS |
1.76GHz+4 % |
24GB |
370W |
|
|
36.84TFLOPS |
1.76GHz+4 % |
24GB |
350W |
|
|
36.84TFLOPS |
1.76GHz+4 % |
24GB |
370W |
|
|
36.84TFLOPS |
1.76GHz+4 % |
24GB |
370W |
|
|
36.84TFLOPS |
1.76GHz+4 % |
24GB |
370W |
|
|
36.84TFLOPS |
1.76GHz+4 % |
24GB |
420W |
|
|
36.84TFLOPS |
1.76GHz+4 % |
24GB |
420W |
|
|
36.84TFLOPS |
1.76GHz+4 % |
24GB |
420W |
|
|
36.84TFLOPS |
1.76GHz+4 % |
24GB |
370W |
|
|
36.52TFLOPS |
1.74GHz+3 % |
24GB |
420W |
|
|
36.52TFLOPS |
1.74GHz+3 % |
24GB |
370W |
|
|
36.52TFLOPS |
1.74GHz+3 % |
24GB |
370W |
|
|
36.52TFLOPS |
1.74GHz+3 % |
24GB |
370W |
|
|
36.52TFLOPS |
1.74GHz+3 % |
24GB |
370W |
|
|
36.21TFLOPS |
1.73GHz+2 % |
24GB |
350W |
|
|
36.21TFLOPS |
1.73GHz+2 % |
24GB |
350W |
|
|
36.21TFLOPS |
1.73GHz+2 % |
24GB |
350W |
|
|
36.21TFLOPS |
1.73GHz+2 % |
24GB |
350W |
|
|
36.21TFLOPS |
1.73GHz+2 % |
24GB |
350W |
|
|
36.21TFLOPS |
1.73GHz+2 % |
24GB |
350W |
|
|
36.21TFLOPS |
1.73GHz+2 % |
24GB |
350W |
|
|
36.21TFLOPS |
1.73GHz+2 % |
24GB |
350W |
|
|
36.21TFLOPS |
1.73GHz+2 % |
24GB |
350W |
|
|
36.21TFLOPS |
1.73GHz+2 % |
24GB |
350W |
|
|
36.21TFLOPS |
1.73GHz+2 % |
24GB |
350W |
|
|
35.89TFLOPS |
1.71GHz+1 % |
24GB |
420W |
|
|
35.89TFLOPS |
1.71GHz+1 % |
24GB |
420W |
|
|
35.89TFLOPS |
1.71GHz+1 % |
24GB |
350W |
|
|
35.89TFLOPS |
1.71GHz+1 % |
24GB |
350W |
|
|
35.58TFLOPS |
1.70GHz |
24GB |
350W |
|
|
35.58TFLOPS |
1.70GHz |
24GB |
350W |
|
|
35.58TFLOPS |
1.70GHz |
24GB |
350W |
|
|
35.58TFLOPS |
1.70GHz |
24GB |
350W |
|
|
35.58TFLOPS |
1.70GHz |
24GB |
350W |
|
|
35.58TFLOPS |
1.70GHz |
24GB |
350W |
|
|
35.58TFLOPS |
1.70GHz |
24GB |
370W |
|
|
35.58TFLOPS |
1.70GHz |
24GB |
370W |
|
|
35.58TFLOPS |
1.70GHz |
24GB |
350W |
|
|
35.58TFLOPS |
1.70GHz |
24GB |
350W |
|
|
35.58TFLOPS |
1.70GHz |
24GB |
350W |
|
|
35.58TFLOPS |
1.70GHz |
24GB |
350W |
|
|
35.58TFLOPS |
1.70GHz |
24GB |
350W |
|
|
35.58TFLOPS |
1.70GHz |
24GB |
350W |
|
|
35.58TFLOPS |
1.70GHz |
24GB |
350W |
|
|
35.58TFLOPS |
1.70GHz |
24GB |
350W |
|
|
35.58TFLOPS |
1.70GHz |
24GB |
350W |
|