









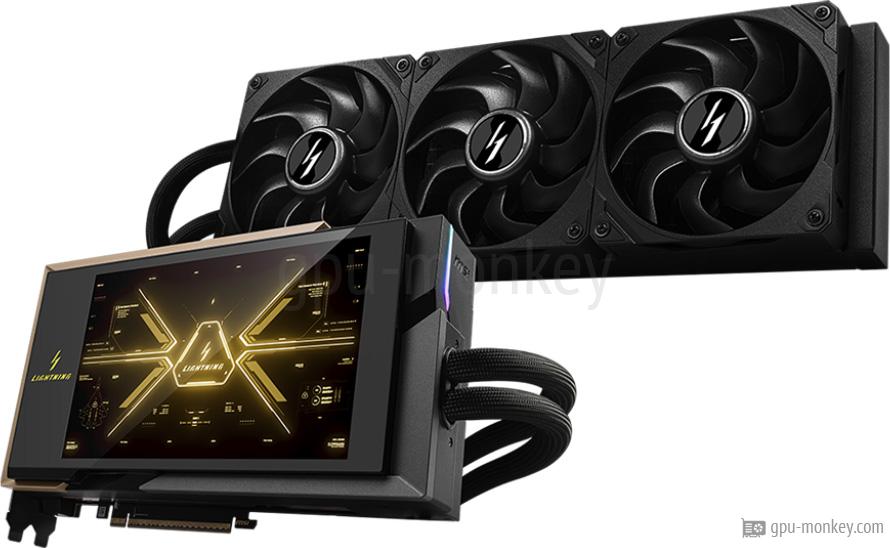
MSI GeForce RTX 5090 LIGHTNING X

MSI GeForce RTX 5090 LIGHTNING X in 3DMark Benchmark (DirectX, Raytracing)

Here you can see how fast the MSI GeForce RTX 5090 LIGHTNING X is in 3DMark Benchmark (DirectX, Raytracing). The performance of the graphics card in benchmarks or games primarily depends on the GPU architecture, the number of texture shaders and the memory size. The MSI GeForce RTX 5090 LIGHTNING X has 32 GB GDDR7 memory.

Boost Clock
2.57GHz
Memory
32GB GDDR7
Shader
21760
Memory bandwidth
1792GB/s

3DMark Benchmark (DirectX, Raytracing)

3DMark is a benchmark program that determines the performance of certain components of a computer and then reports the performance as a numerical value.
Time Spy Graphics score Rank 16 / 5,638

  1. 49,899
  2. 49,899
  3. 49,899
  4. 49,750
  5. 49,601
  6. 49,369
  7. 49,369

Time Spy Extreme Graphics score Rank 16 / 5,633

  1. 26,345
  2. 26,345
  3. 26,345
  4. 26,266
  5. 26,187
  6. 26,064
  7. 26,064

Steel Nomad Light Graphics score Rank 16 / 1,247

  1. 56,447
  2. 56,447
  3. 56,447
  4. 56,278
  5. 56,109
  6. 55,846
  7. 55,846

Steel Nomad Graphics score Rank 16 / 1,247

  1. 14,480
  2. 14,480
  3. 14,480
  4. 14,437
  5. 14,393
  6. 14,326
  7. 14,326

Port Royal (Raytracing) Rank 16 / 4,176

  1. 37,287
  2. 37,287
  3. 37,287
  4. 37,175
  5. 37,064
  6. 36,890
  7. 36,890

Speed Way Graphics Score (Raytracing) Rank 16 / 3,536

  1. 14,791
  2. 14,791
  3. 14,791
  4. 14,747
  5. 14,702
  6. 14,634
  7. 14,634

Solar Bay (Raytracing) Rank 16 / 1,247

  1. 222,706
  2. 222,706
  3. 222,706
  4. 222,040
  5. 221,373
  6. 220,337
  7. 220,337

More benchmarks for the graphics card MSI GeForce RTX 5090 LIGHTNING X